
The Money We Found Hiding in Recent Amazon Advertising Audits (and How We Fixed It)

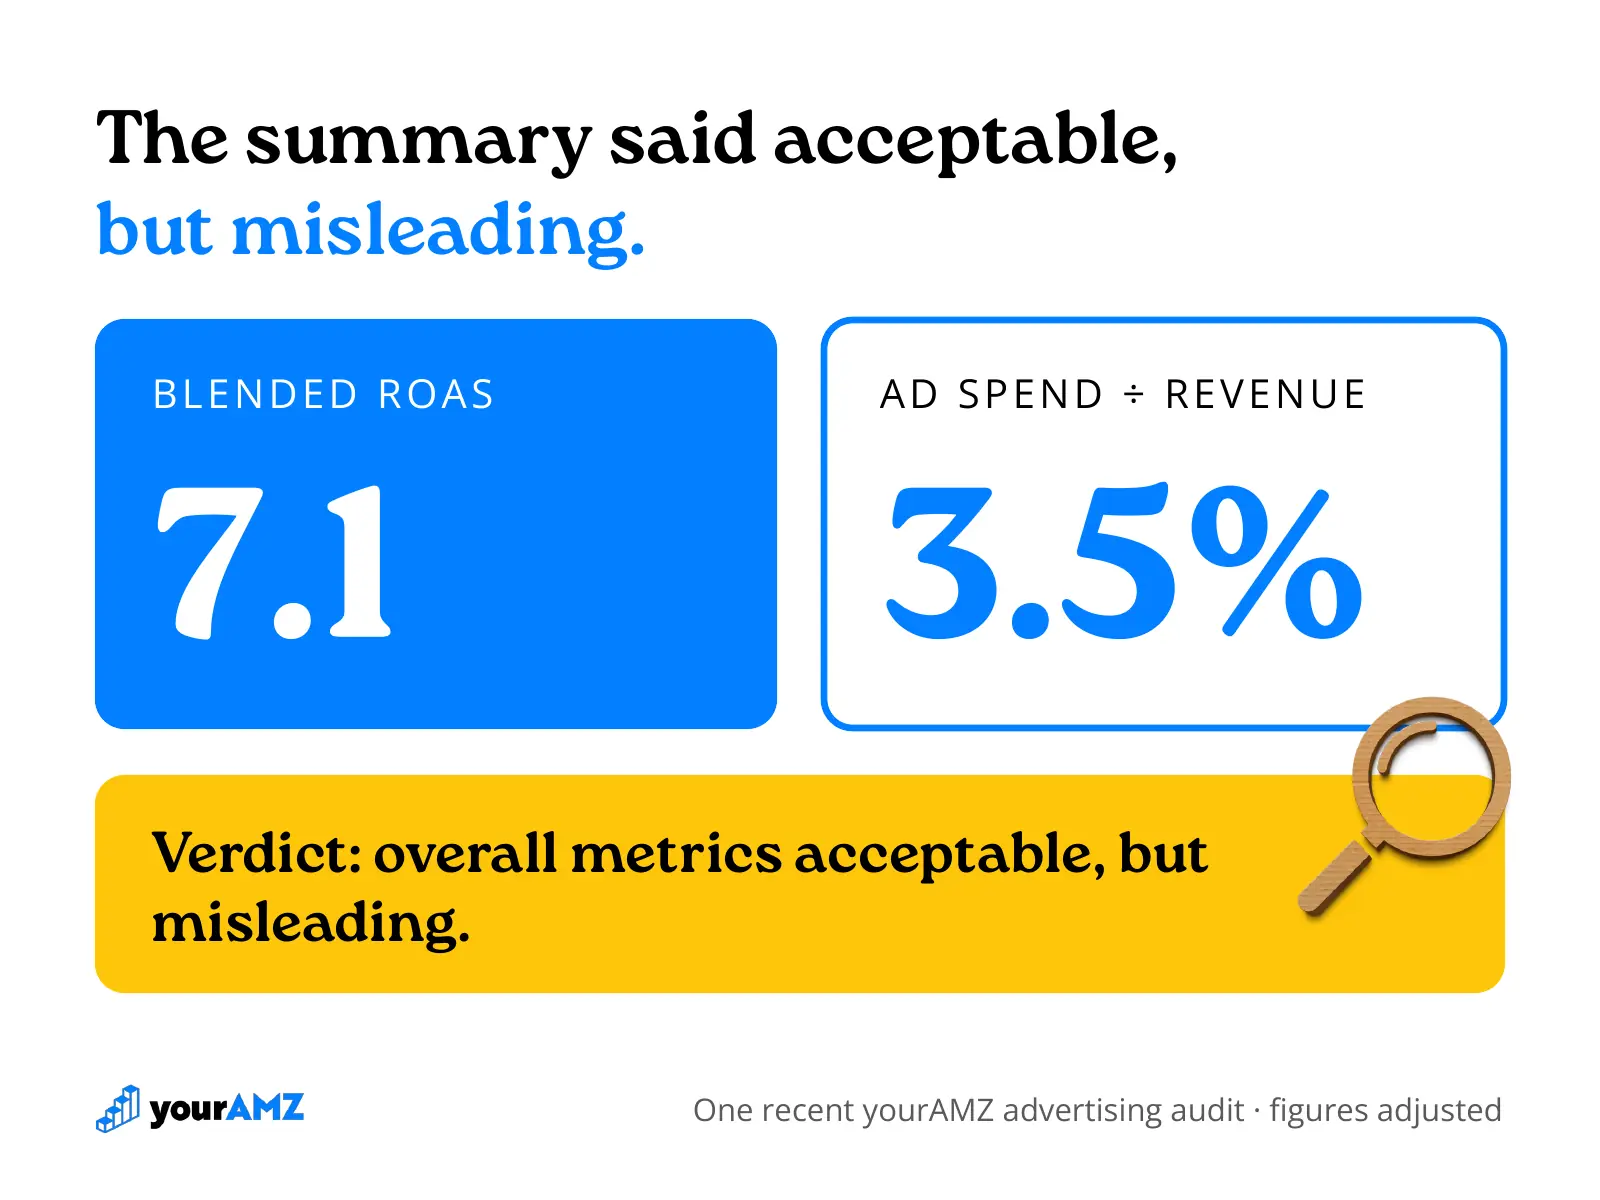
One of our recent advertising audits opened on a 7.1 ROAS. Most brand owners would be happy with that. Our advertising audit's executive summary called it acceptable but misleading, and the rest of the report showed why.
Over the last few months, we ran our Advanced Advertising Audit on a range of Amazon accounts, and these three had findings worth sharing. The brands sold different products, and their ad accounts went wrong in similar ways: dashboards that looked fine, with money leaking underneath.
This blog walks through the five checks we run first in every advertising audit, what each one turned up, and what happened when two accounts like these became clients. Identifying details are changed and figures are lightly adjusted throughout.
If you'd rather see these numbers for your own account, book a free Advanced Advertising Audit.
Does your ad spend match your goal?
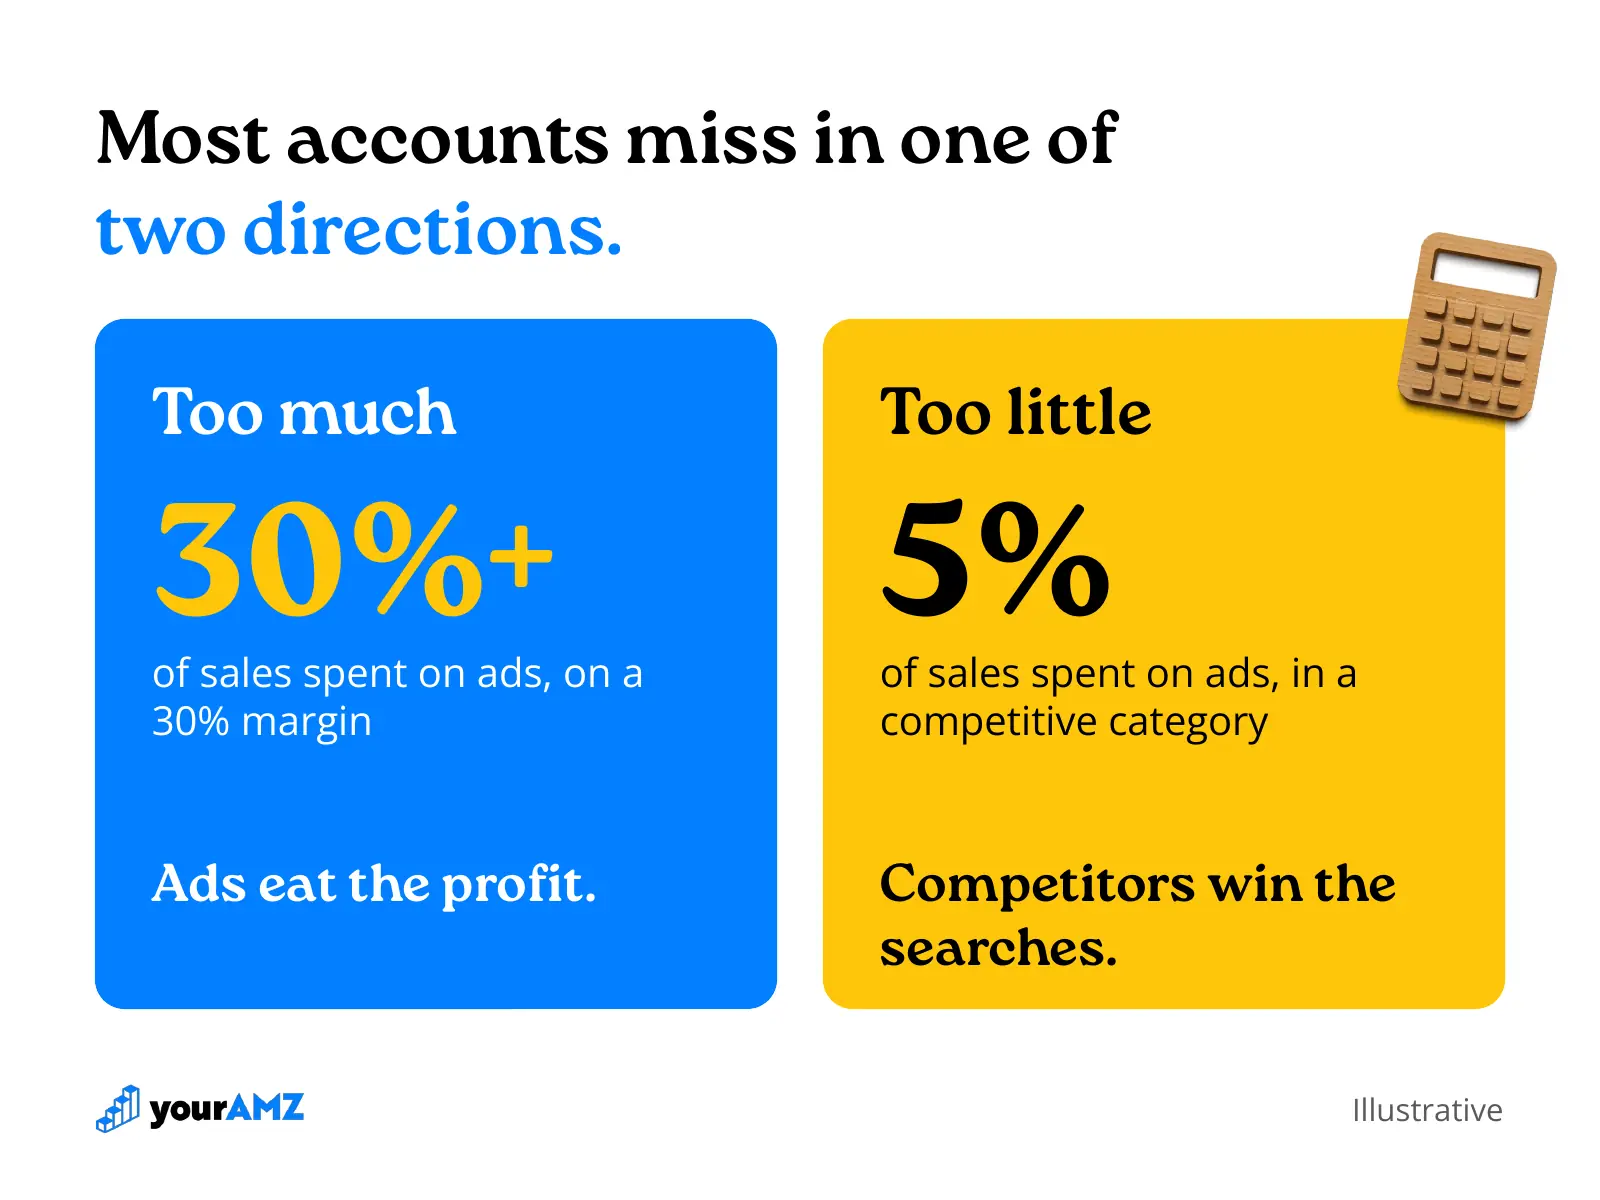
The first thing our founder, Petros, checks in an advertising audit is how much the account spends against what the business is trying to do. It is usually off in one of two directions.
Some accounts spend too much. A brand running on a 30% margin that spends 30% or more of its sales on ads is handing most of its profit to Amazon, regardless of ROAS.
Just as often, accounts spend too little. Spending 5% of sales in a competitive category leaves a brand missing from searches its competitors are paying to win.
In one advertising audit, ad spend was 3.5% of revenue, and about two-thirds of the brand's products had no ad spend at all. Another account had both problems at once: one product spent twice its own revenue on ads, while several of its best sellers had room for more budget.
Underspending is the more expensive of the two. Overspending shows up on a report as waste. Missed growth doesn't show up anywhere, so it's the hardest problem to explain to founders and brand owners. We've watched brands hesitate to spend more and lose that growth to a competitor.
The right level depends on the goal. A brand pushing for growth and a brand protecting its margin should spend very differently, so the advertising audit starts with the goal and works back to the budget.
Paying to re-buy your own customers
In two of these advertising audits, about half of all search spend went to the brand's own name. In the accounts we manage, we hold branded spend at 10-20% of ad spend.
Branded ads look excellent on paper. Someone searching your brand name has usually already decided to buy from you, so they click and convert at high rates.
In the advertising audit with the 7.1 ROAS, branded terms took 55% of spend and returned a 12.18 ROAS. The other 45% of ad spend went to non-branded search terms and returned a 1.73 ROAS, which works out to a 58% ACoS. The account was losing money on nearly every new customer it paid for, and the blended number covered it up.
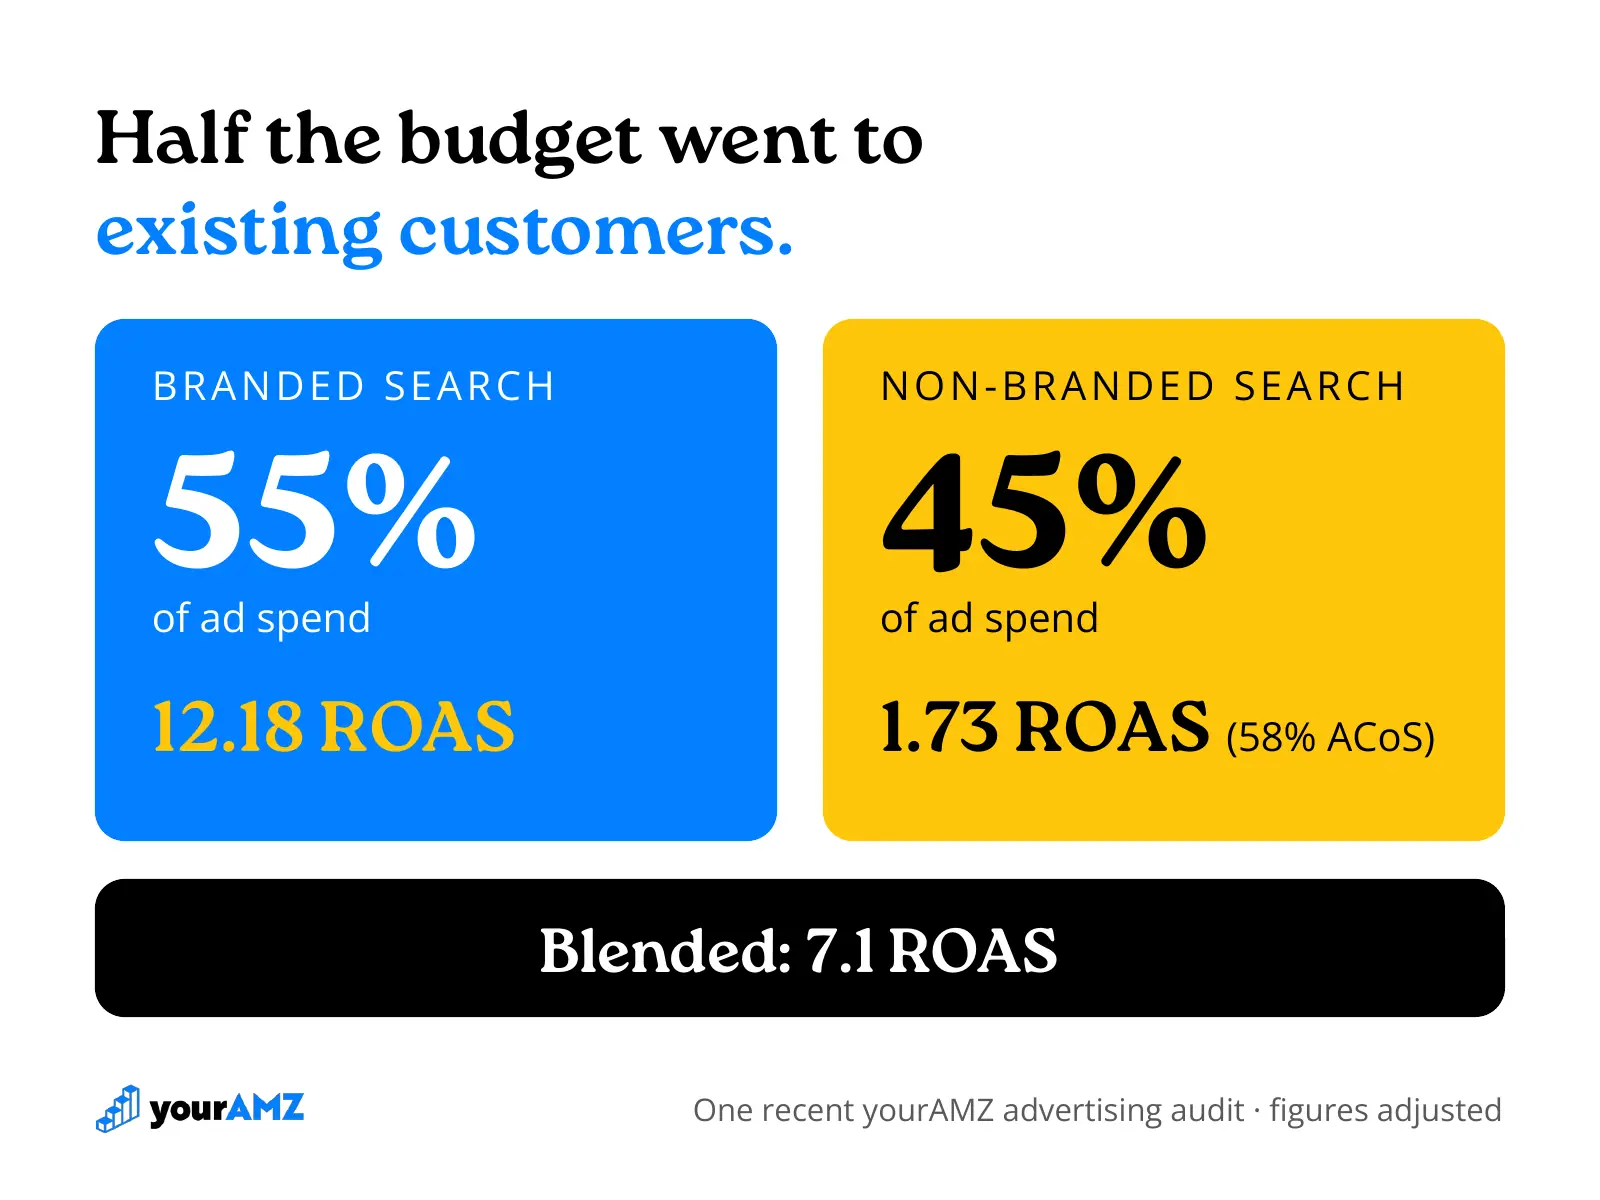
Petros explains it this way: a single ROAS number mixes two different jobs. Branded spend keeps existing customers, and non-branded spend wins new ones, so each needs its own target.
Many branded sales would have happened without the ad, so the next ad dollar should be judged on the new customers it brings in. We cover this in more depth in why we ignore ROAS as an account-level metric.
The third account kept branded spend at a healthy 11.5%, which shows you can protect your brand name without spending half the budget on it.
Who decides where your money goes?
In two of the advertising audits, auto campaigns carried most of the spend: 61% in one account and 100% in the other. The account at 61% spent nothing on product-page targeting.
In the accounts we manage, we run 60-80% of spend on manual keyword targeting (mostly single-keyword exact match), 20-40% on manual product-page targeting, and 1-5% on auto, used only to discover new search terms.
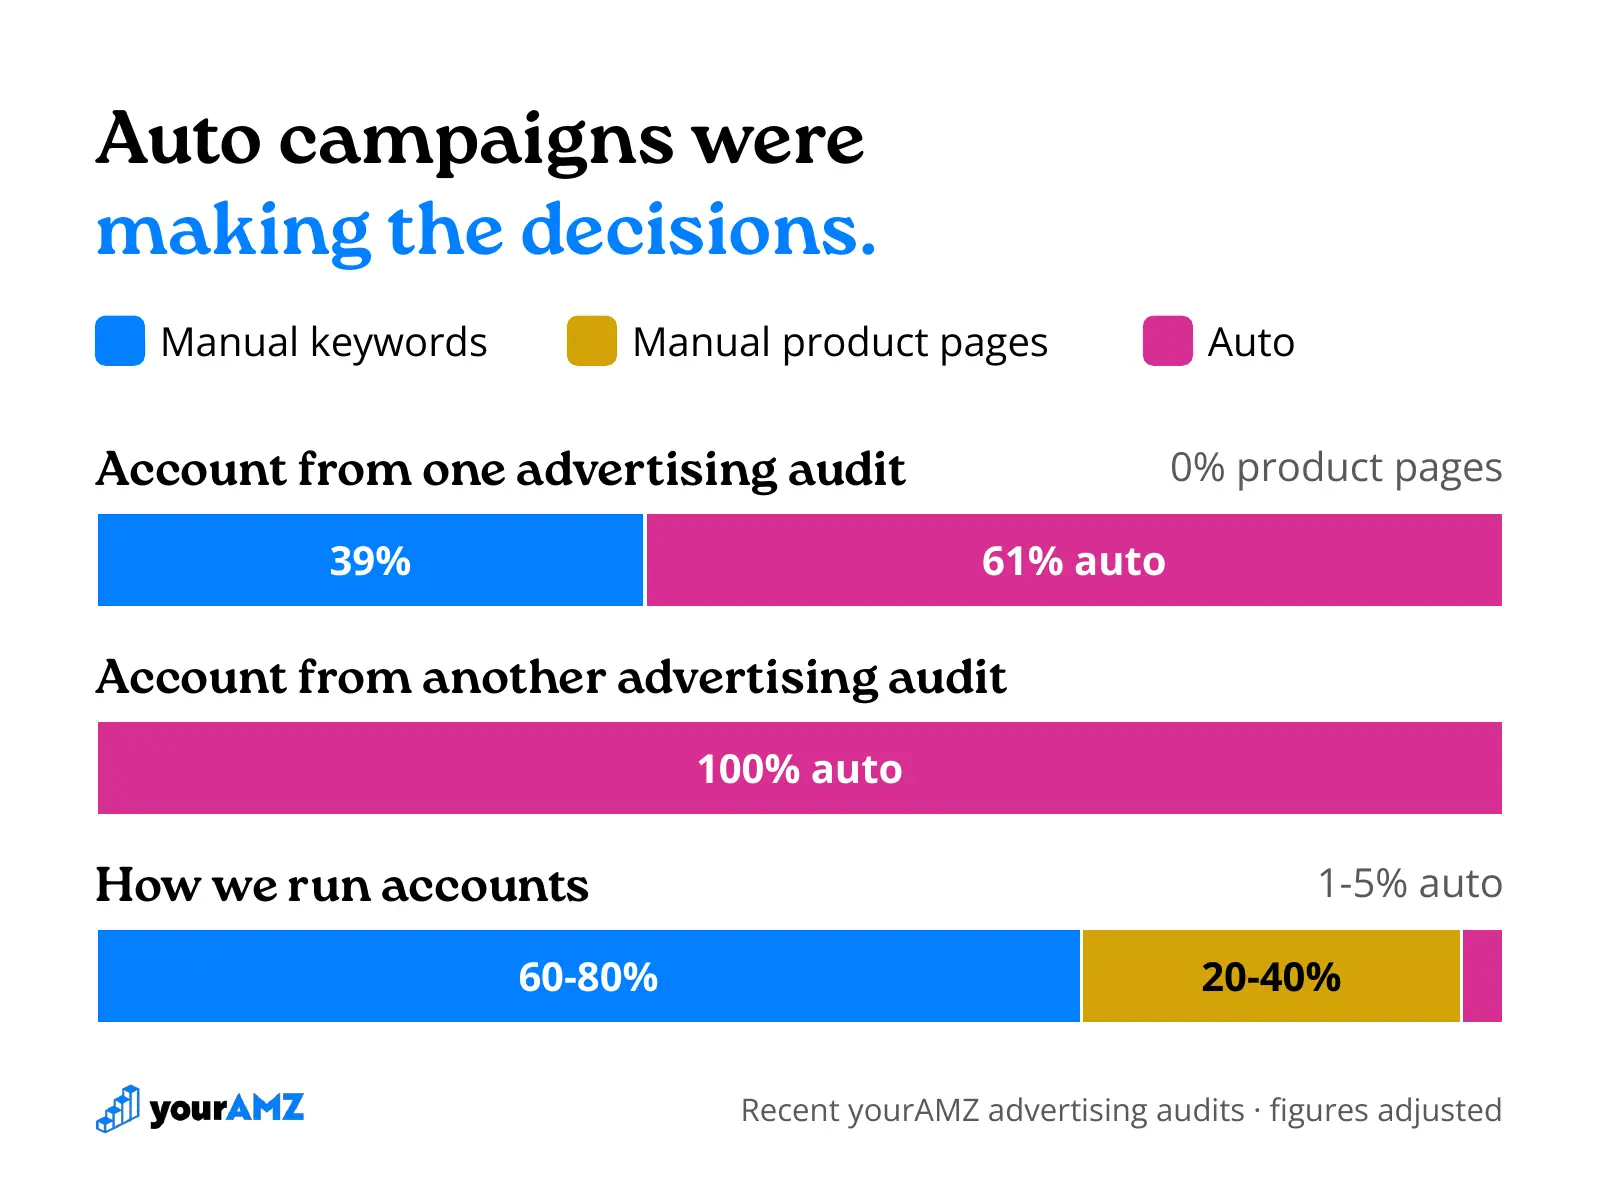
We keep auto campaigns that low because an auto campaign spreads one budget and one bid across every search it matches, branded and non-branded alike.
When branded and non-branded targets share a bid, spend drifts toward the branded terms, because those shoppers click and buy more often. The campaign's numbers look great, and the searches that bring in new customers get whatever is left, or nothing at all.
When non-branded keywords sit in their own campaigns, each one gets a bid based on what its clicks are actually worth.
Say your brand name converts three times better than a generic search like "stainless water bottle." In an auto campaign, both get the same bid. The brand name's results make that bid look profitable, so the generic search ends up paying more per click than it can afford.
Put simply: a shared bid lets your branded sales hide what you are overpaying for new customers.
The best placement gets the smallest budget
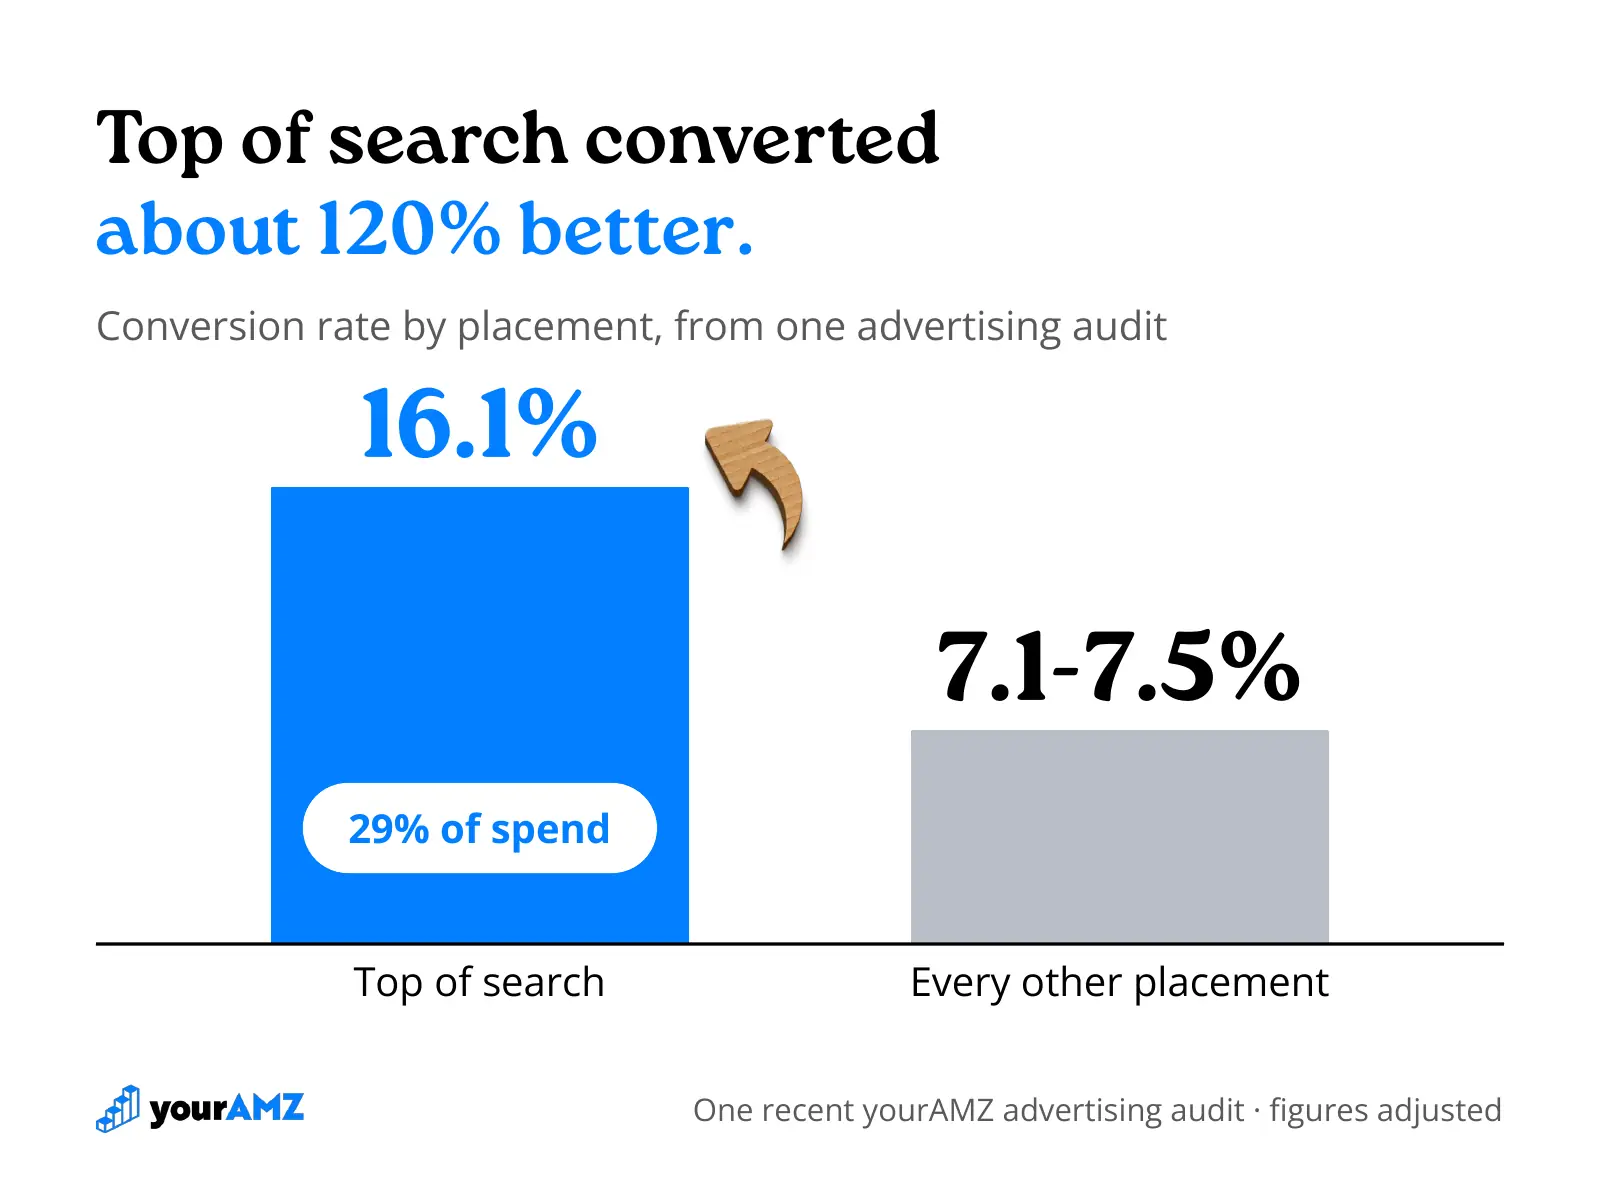
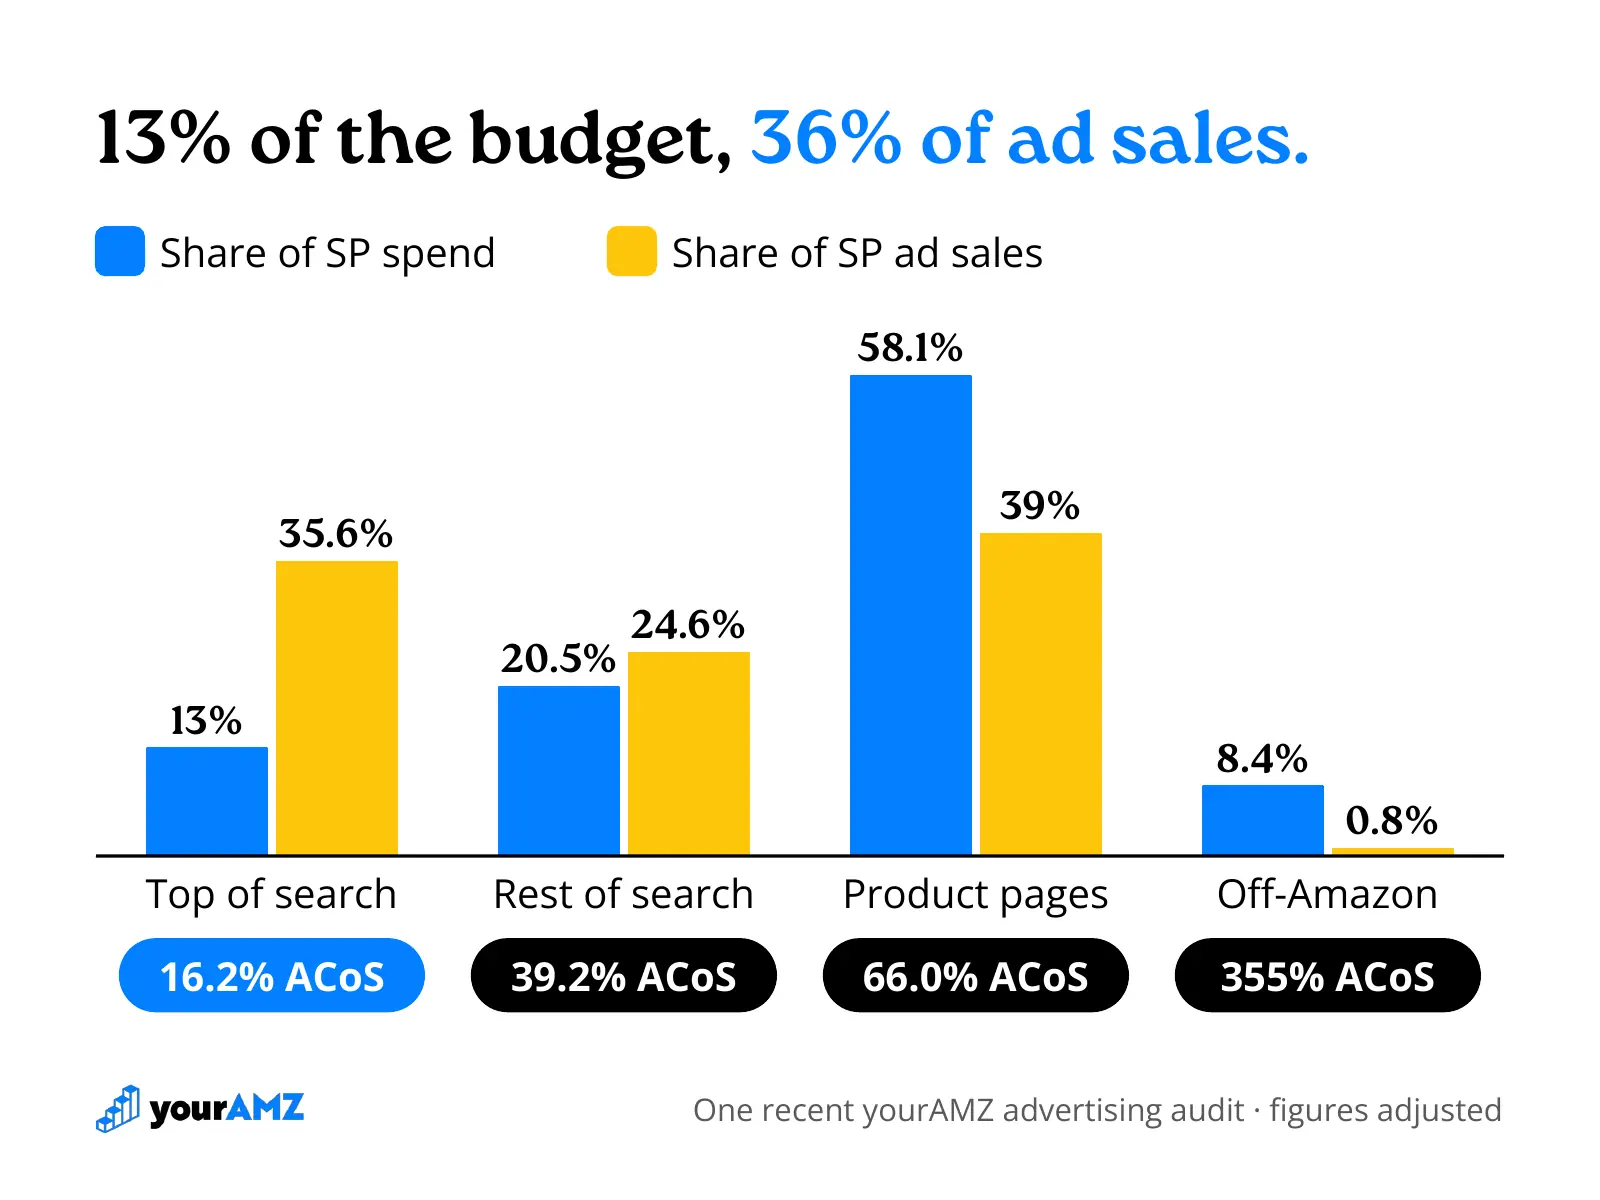
Top of search converted best in all three advertising audits, and in two of them it got one of the smallest shares of the budget.
In one account, top of search converted at 16.1%, against 7.1-7.5% everywhere else (about 120% better), and got only 29% of spend.
In another, top of search took 13% of Sponsored Products spend and produced 36% of ad sales, at a 16% ACoS and an 18.1% conversion rate. Product pages took 58% of spend and returned 39% of ad sales at a 66% ACoS.
The third account was the exception. Top of search converted 6.5 times better than product pages there (34.5% vs 5.3%) and already received 50% of spend.
Moving budget to the placement that converts best is one of the fastest fixes we make, because the account is already reaching those shoppers.
Where your own budget sits by placement is one of the first things our free Advanced Advertising Audit shows.
Cut the waste, then feed the winners
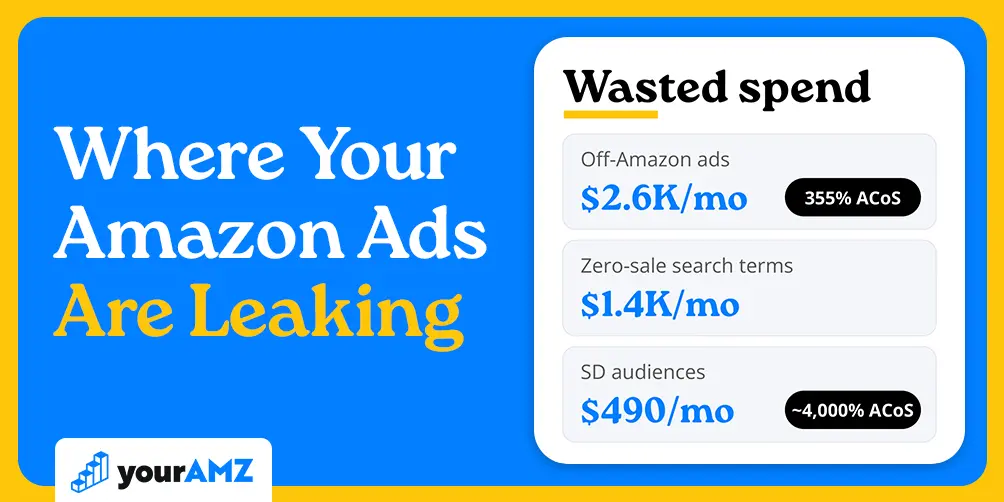
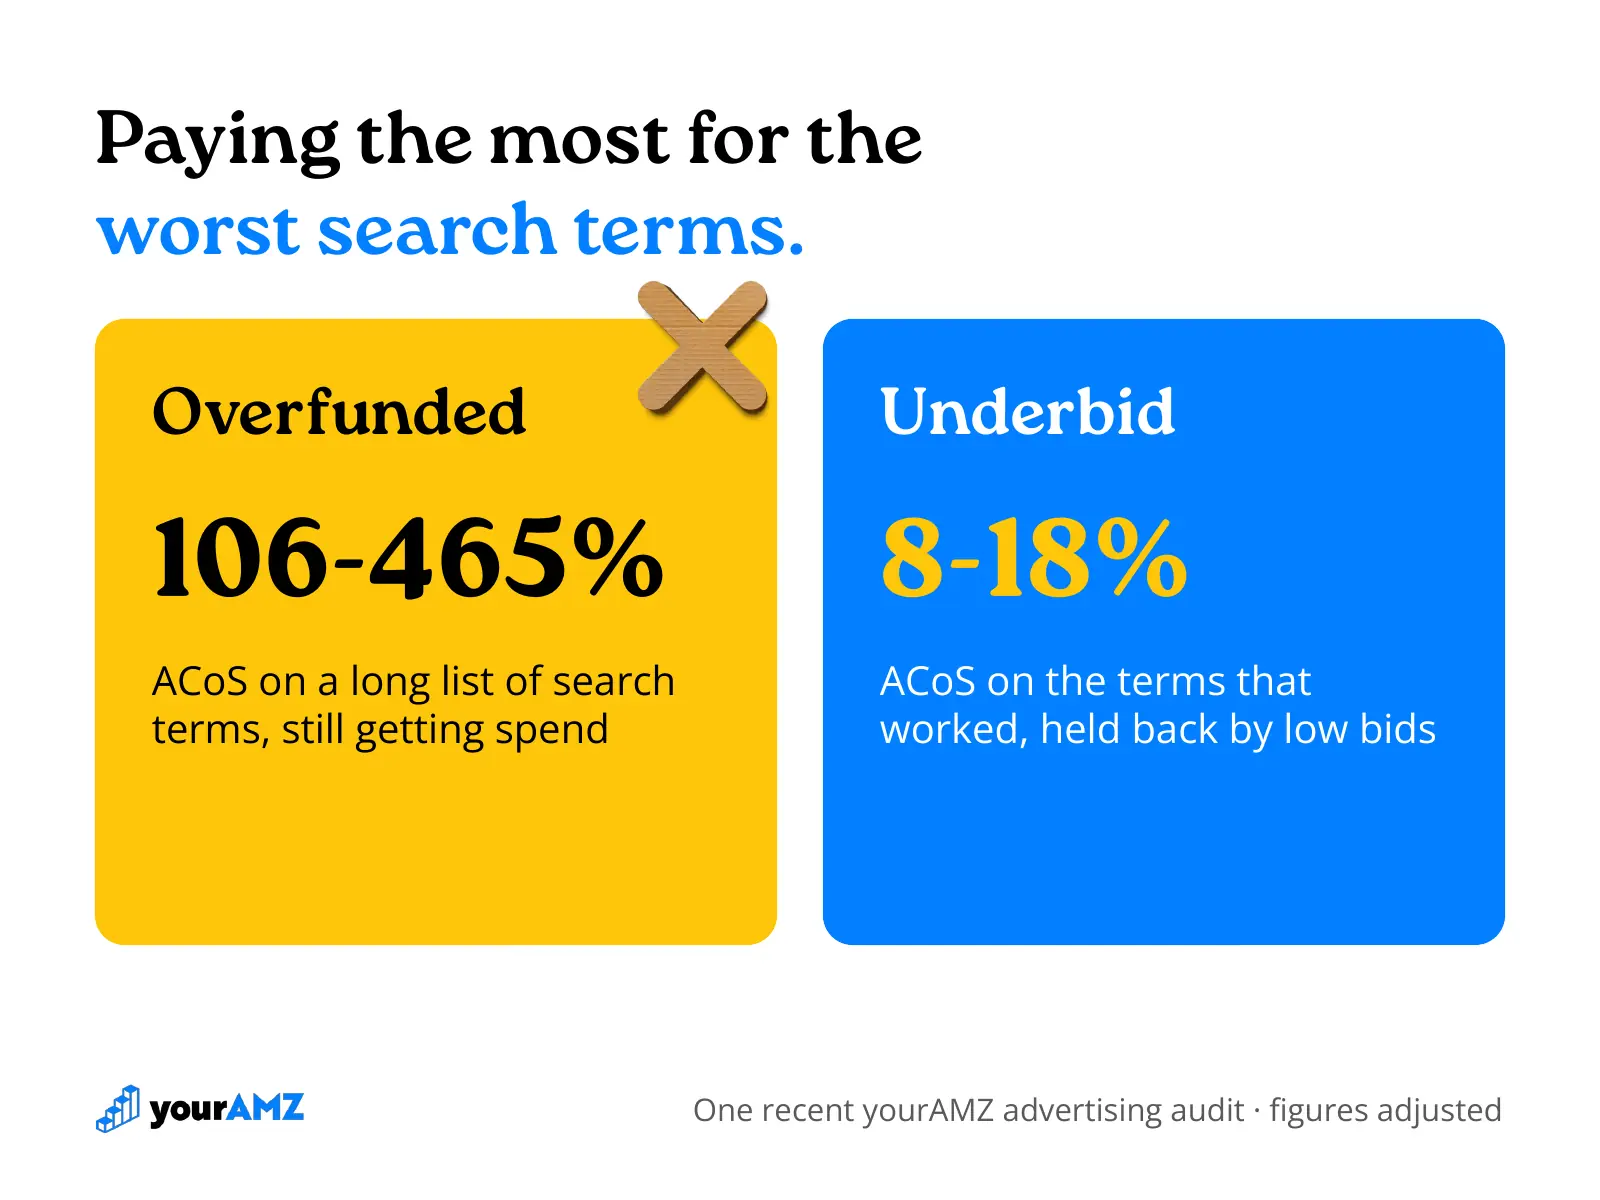
Wasted spend showed up in every account from these advertising audits. In one, a long list of search terms ran at 106-465% ACoS, while search terms that were profitable at 8-18% ACoS had bids too low to win more traffic.
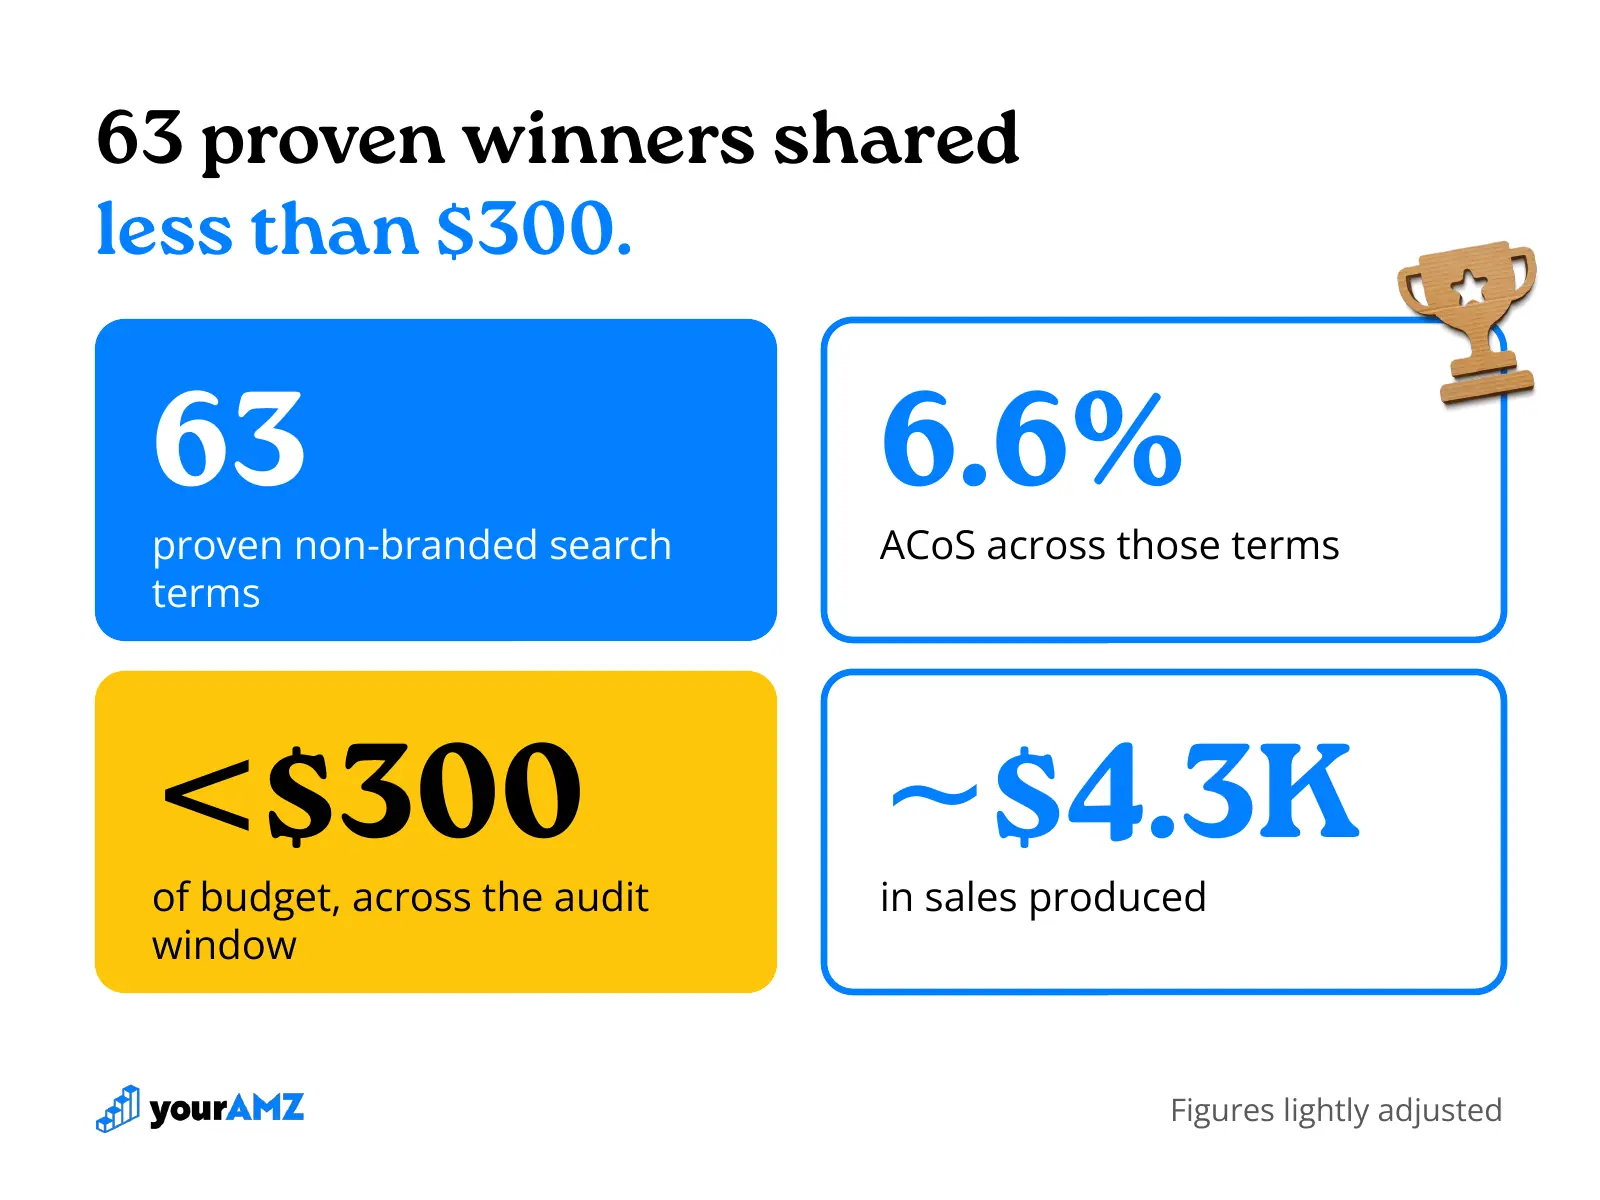
In another account, 63 non-branded search terms had already proven they convert, at a 6.6% ACoS. Over the whole period we reviewed, those 63 terms received less than $300 of budget between them and produced about $4.3K in sales. The search-term data already showed which searches worked. Nobody had moved them into campaigns with real budgets.
The order of the fix matters, because careless cutting can do as much damage as the waste itself:
- Cut irrelevant terms first.
- Lower bids on weak terms that are still relevant. A relevant term at a high ACoS often works at a lower bid.
- Handle high-volume keywords in steps. Pulling spend from a big keyword too fast can cost organic rank on it.
- Give proven winners their own exact-match campaigns, with budgets that match their results.
- Build back on non-branded terms that reach new customers, using the money freed up in the first three steps.
What happened when we fixed two of these accounts
One client was overspending and one was underspending. Both ended up with more profit.
A brand that was spending too much
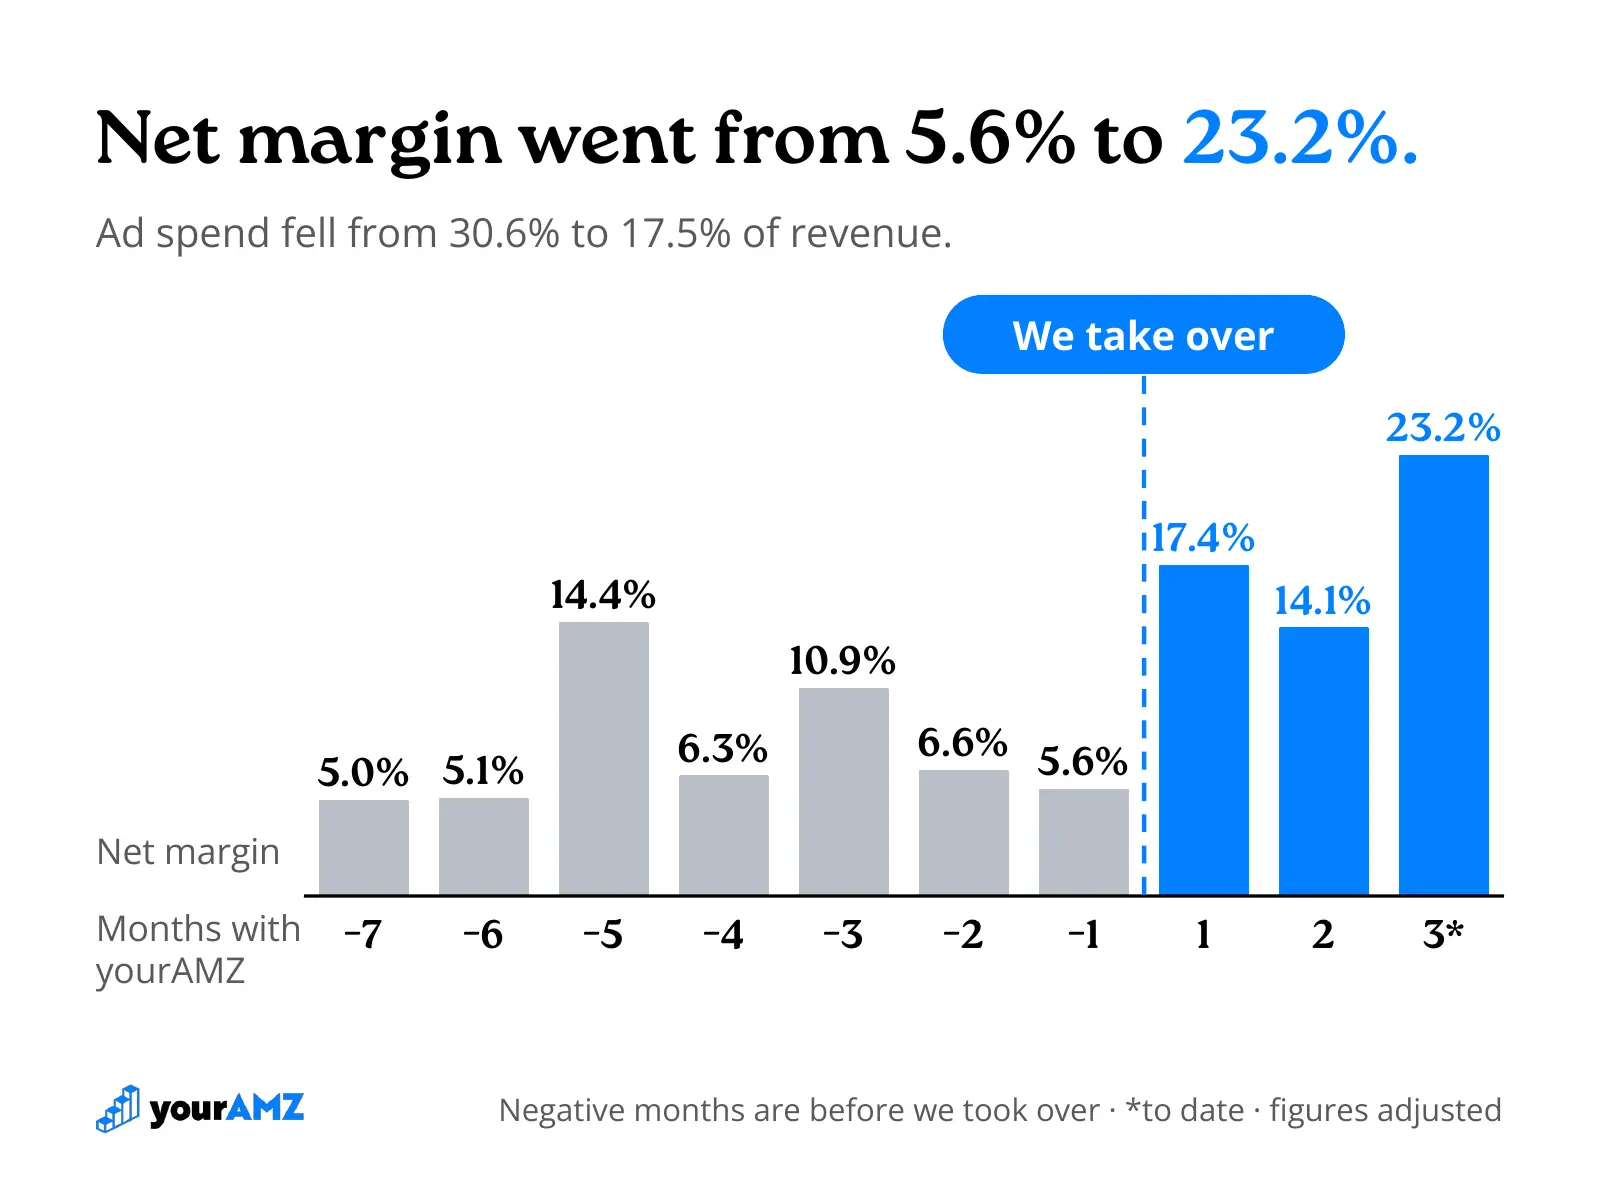
This account is one of the three accounts in this post, and it became a client a few months ago. In the six months before we took over, ad spend ran between 26% and 37% of revenue every month, and net margin after all costs landed between 5% and 15%. In the last month before we took over, it was 5.6% (the last gray bar below).
In our first month, we cut ad spend by about $5K. Revenue dipped about 7%, net margin went from 5.6% to 17.4%, and net profit roughly tripled. Month two was slower while we tested new targeting and promotions, and margin held at 14.1%. So far in month three, ad spend is down to 17.5% of revenue, the lowest since we started, and margin is at 23.2%. With a few days still to go in the month, it is already the brand's most profitable month of the year.
Petros put it this way: from the outside, nothing dramatic happened. Sales stayed in the same range, but profitability jumped.
A brand that was spending too little
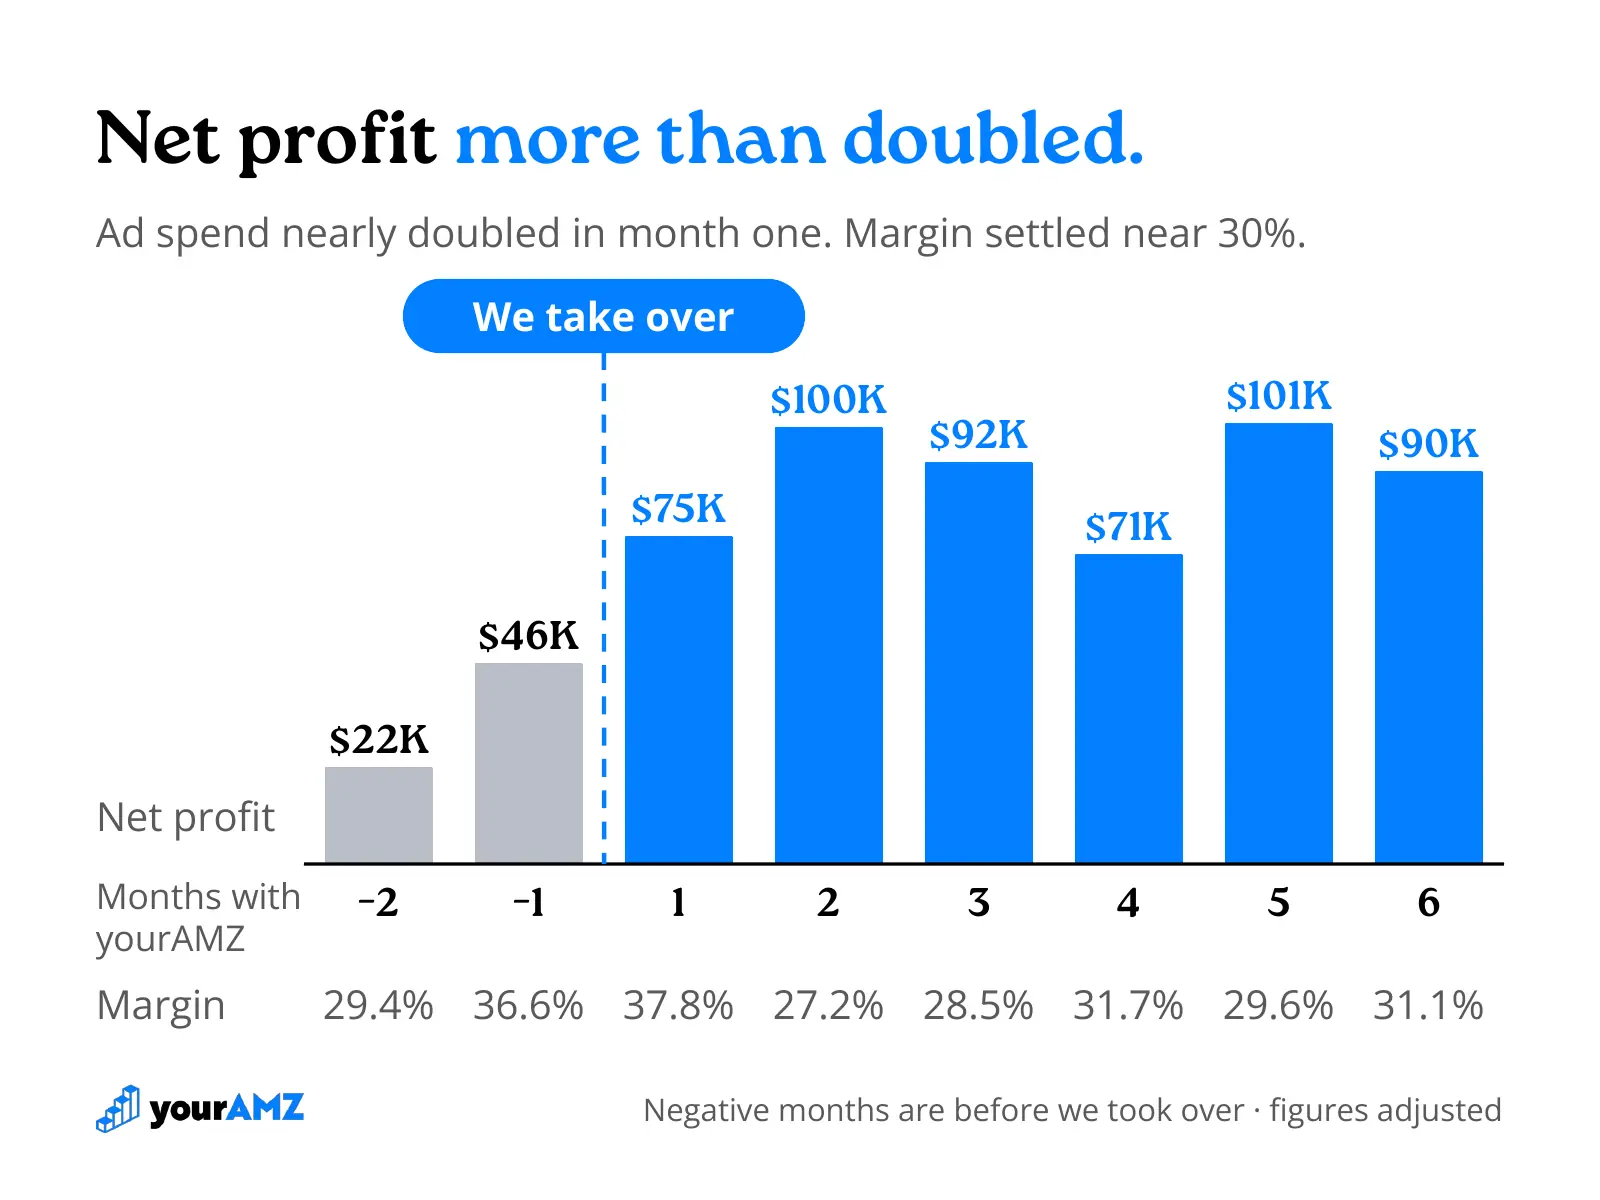
This is the same brand from our recent blog about ROAS vs TACoS. In the month before we took over, it spent about 10% of revenue on ads at a 36.6% net margin, and Petros estimates about half of that spend was doing useful work. The brand wanted growth, and its high ROAS wasn't producing it.
- In our first month, we nearly doubled ad spend. Revenue rose about 70%, and margin held at 37.8%.
- In month two, revenue grew another 80%. Margin came down to 27.2%, a trade we expected with a growth goal, and net profit more than doubled compared with the month before we started.
Margin has held near 30% every month since.
Comparing the month before we started with our second month, about $32K more in monthly ad spend brought in about $250K more revenue and about $54K more net profit. The brand later ran into inventory problems and still had its most profitable month on record in our fifth month.
Find out what your account is hiding
Each of these problems was hidden from the accounts' main dashboards, and each became obvious once someone split the spend apart: branded from non-branded, placement by placement, search term by search term. That breakdown is what our free Advanced Advertising Audit does.
A senior strategist builds it by hand from your own bulk files and order data, then walks you through it on a call, with every number verifiable line by line in your own reports. We currently only take three per month.
Book your free Advanced Advertising Audit
Unlock Your Amazon Potential

Continue Reading

Selling on Amazon Canada in 2027: What a US Brand Needs Before the First Shipment