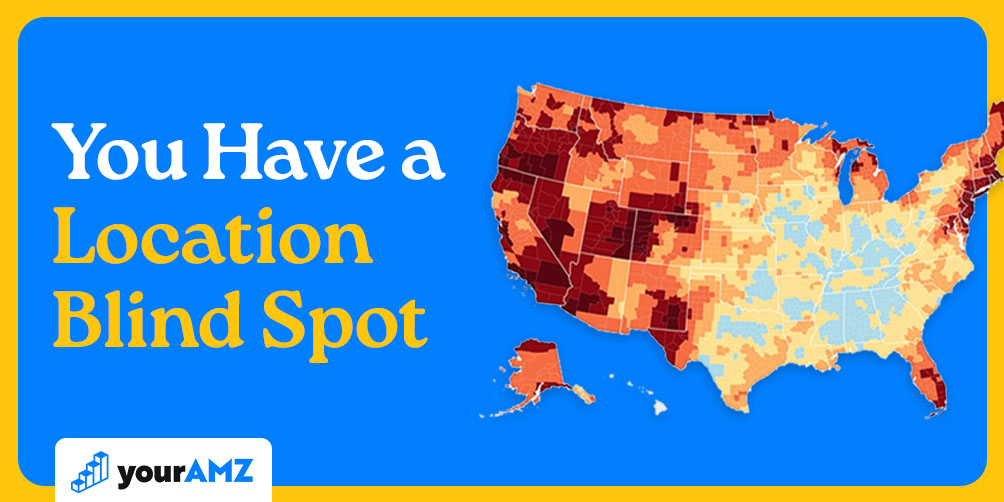
Your Amazon ads have a location blind spot (with Ken Sheehan of KnoWhere)
.png)
Watch the interview
Most Amazon brands selling $100K+ per month review their keywords, ROAS, TACoS, and click-through rate every week. Almost none look at performance by location, and fewer still by zip code. So when ad efficiency slips as spend grows, the usual explanation is saturation: the brand has reached the buyers who want the product, and every new dollar has to work harder on colder audiences and broader keywords.
Sometimes that's true. Often the account has a location blind spot instead. The ad platforms keep spending in the zip codes that already convert, while zip codes with the same buying potential barely see the brand.
To explain how that happens and how to find those zip codes, I sat down with Ken Sheehan, founder of KnoWhere, a geospatial analytics company. Ken started his career more than 20 years ago modeling habitat for rare and endangered fish, which meant predicting where a scarce animal would turn up based on everything around it. About ten years ago, he started using that same approach with consumers, and he has since built models for roughly 200 companies, from small brands to eight- and nine-figure enterprises.
This blog is a recap of our interview: why platforms over-serve the same zip codes, what a match market is, why demographics change meaning from one place to the next, and how we feed Ken's zip code findings into Amazon DSP for brands we work on together.
Why do ad platforms keep serving the same zip codes?
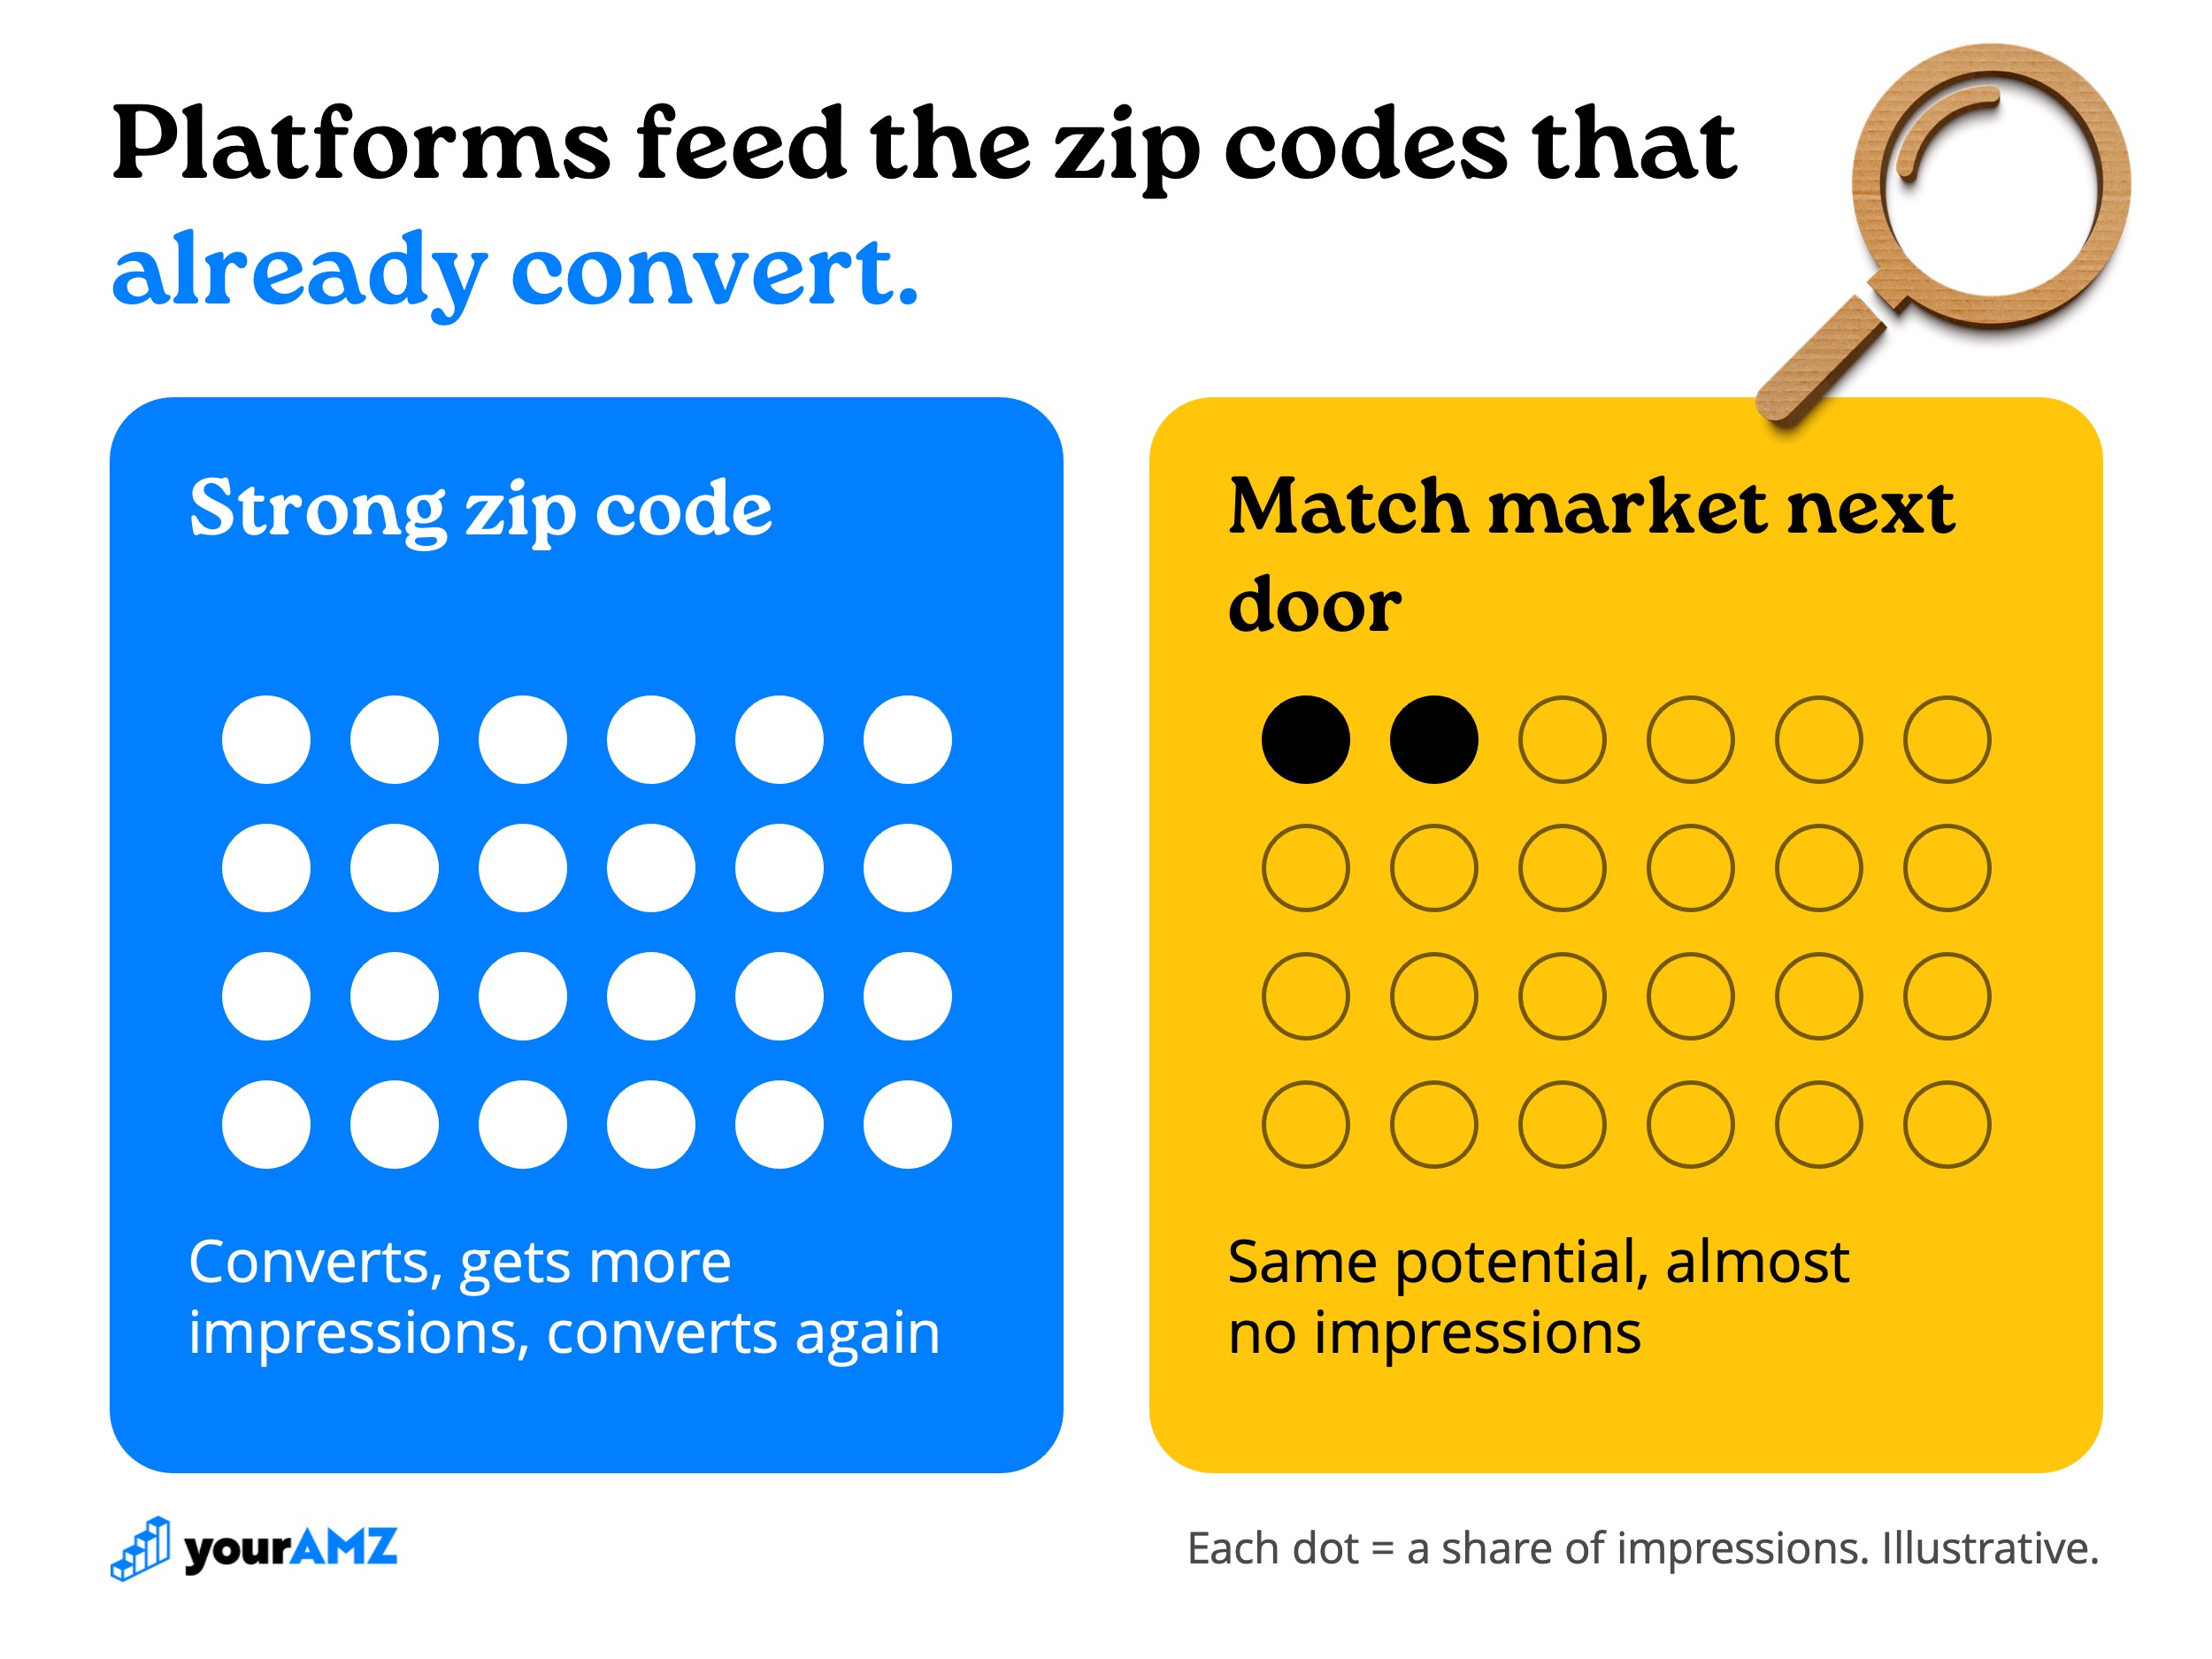
Because the zip codes that convert send the strongest signal, and the platform follows it. When a campaign targets the whole country, Google, Meta, or Amazon decides where the impressions land. A few zip codes start converting, the algorithm pushes more impressions into them, they convert again, and the loop tightens.
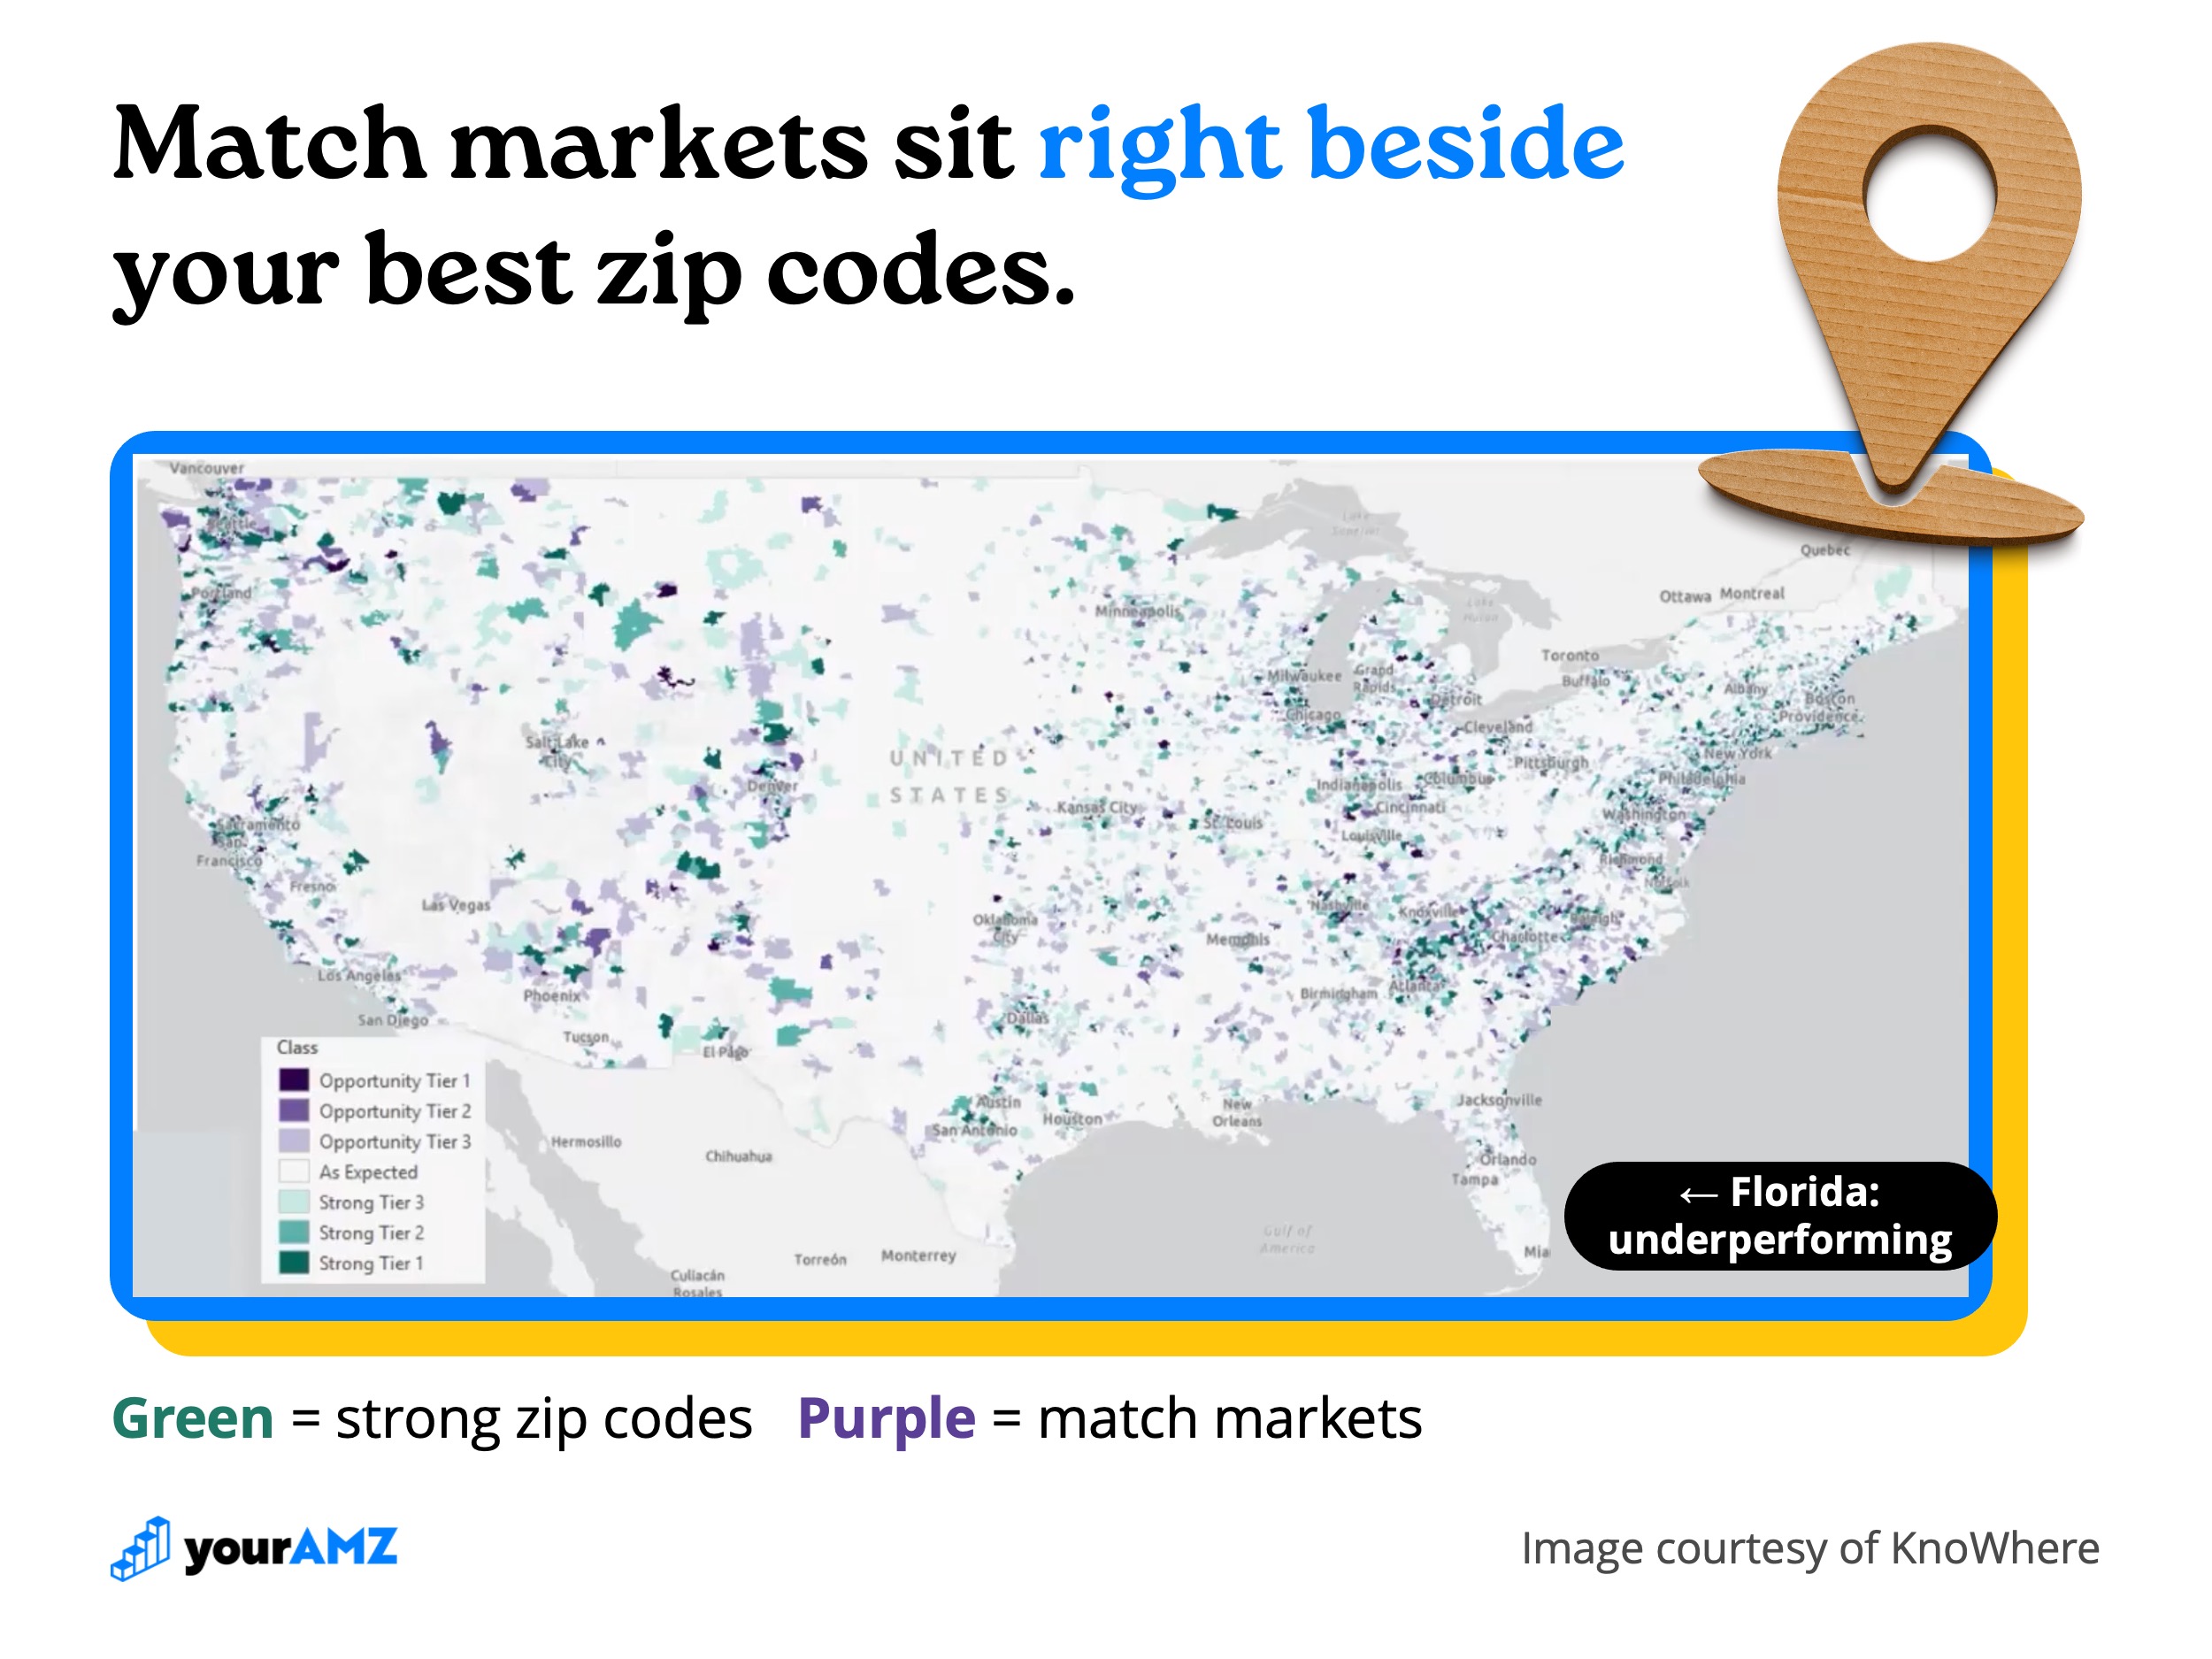
What the platform won't tell you, in Ken's words, is that "next door to that zip code is actually a match market which has equal potential." That zip code never got the impressions, so it never produced the data that would earn it more. The diagram below shows the pattern.
Two things make this harder as a brand grows. Privacy changes have thinned out individual tracking, so platforms lean on whatever patterns they can still see. And every brand in your category is bidding for the same zip codes. Location patterns exist whether or not anyone tracks a person, and Ken's work adds them back into the system so the algorithm has a better group of people to look for.
This is how efficiency can slide while a brand still has plenty of untouched buyers. When you target the whole country, a few zip codes get most of your ads and many others with the same potential barely see them. Your national numbers average the two together, so you never see the gap.
What is a match market?
A match market is a zip code with the same buying potential as your best zip codes that your ads haven't reached yet. It might have a few sales or none at all. Your own sales data can't reveal it, because a zip code that never saw your ads looks the same as one that saw them and didn't buy.
Ken's models sort every zip code in the US into tiers. Strong tiers are where a brand already sells well. Opportunity tiers are the match markets: places that should perform like the strong tiers and don't yet. In the client map below, the purple opportunity zip codes sit right beside the green strong ones in nearly every region. Florida stands out too, a heavily populated state where this client sold far less than its population would suggest.
Growth without a bigger budget
For a brand on a fixed budget, the fix is a reallocation. Pull some impressions out of the saturated strong zip codes and point them at the opportunity tiers. "You don't change your budget," Ken said, "but all of a sudden you've got a new market." In his experience, opportunity tiers often catch up fast once they get the exposure they were missing.
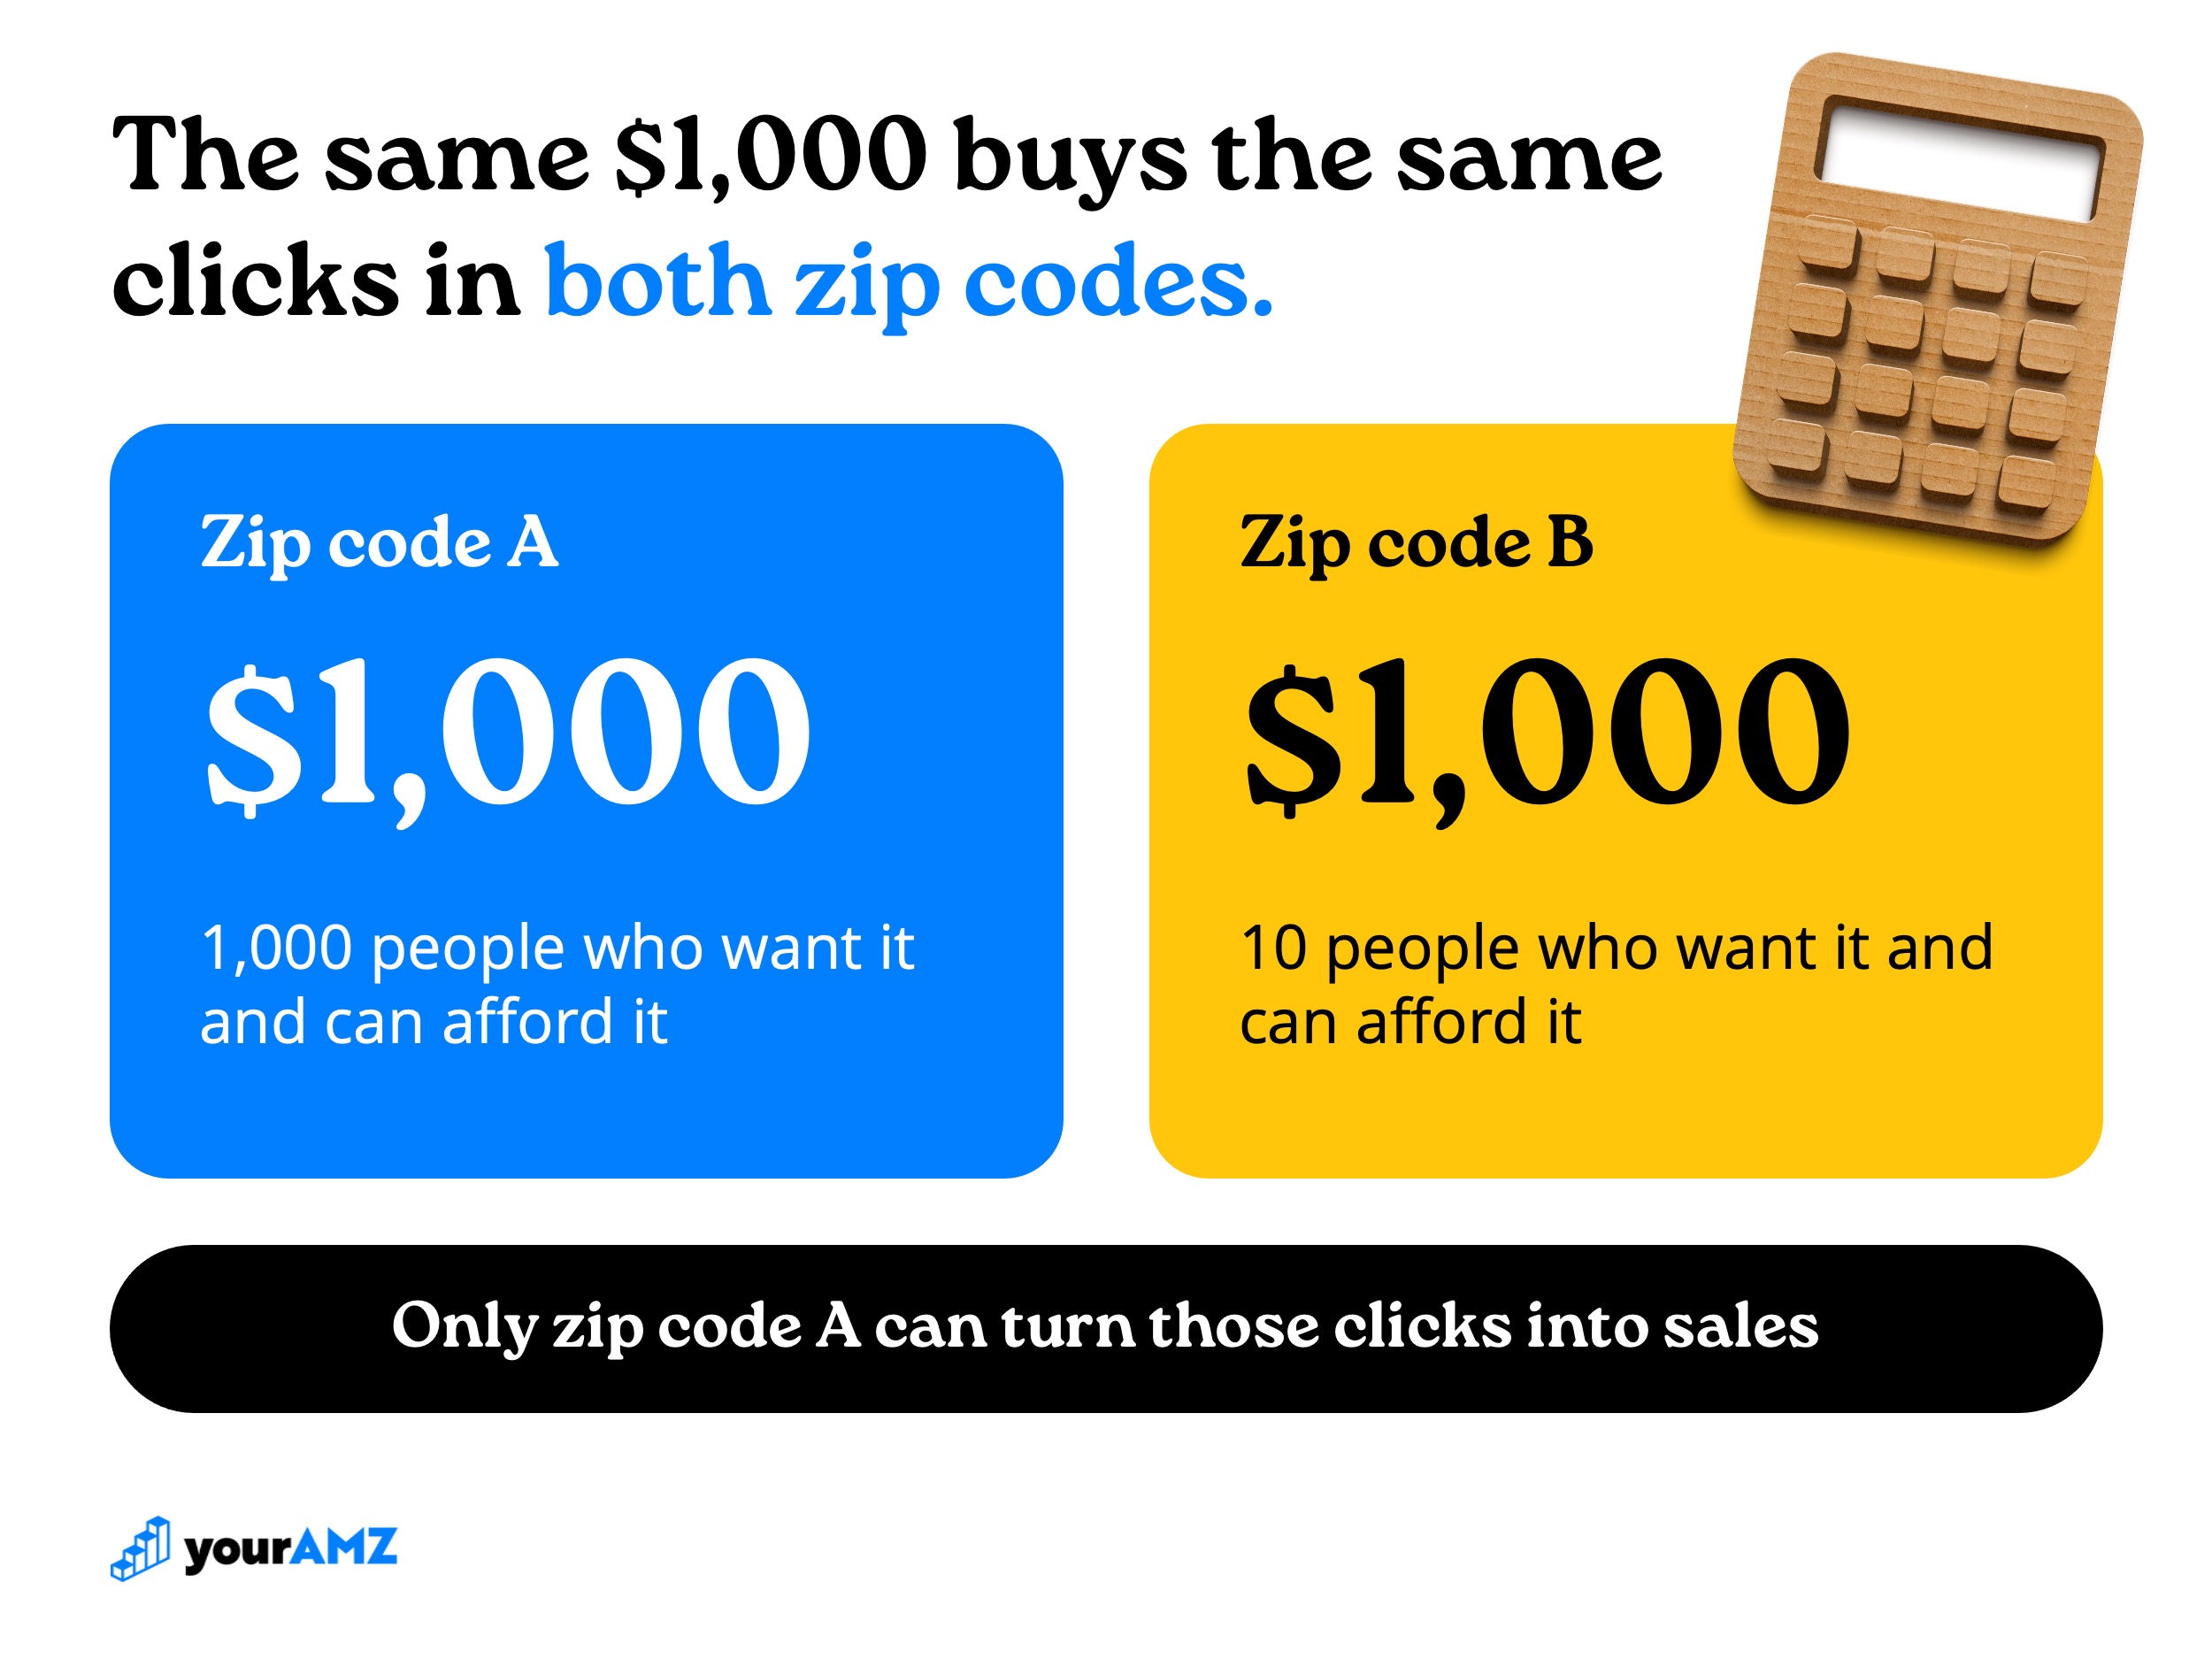
In Ken's example, you put $1,000 of ads into a zip code where 1,000 people want your product and can afford it, then put the same $1,000 into a zip code where 10 people do. You pay for the same clicks in both, and only one of them can turn those clicks into sales.
Why demographics alone mislead
Brands that do filter their ads usually start with demographics: an age range, an income band, an interest. A demographic means different things in different places, so the filter can point the budget at the wrong people.
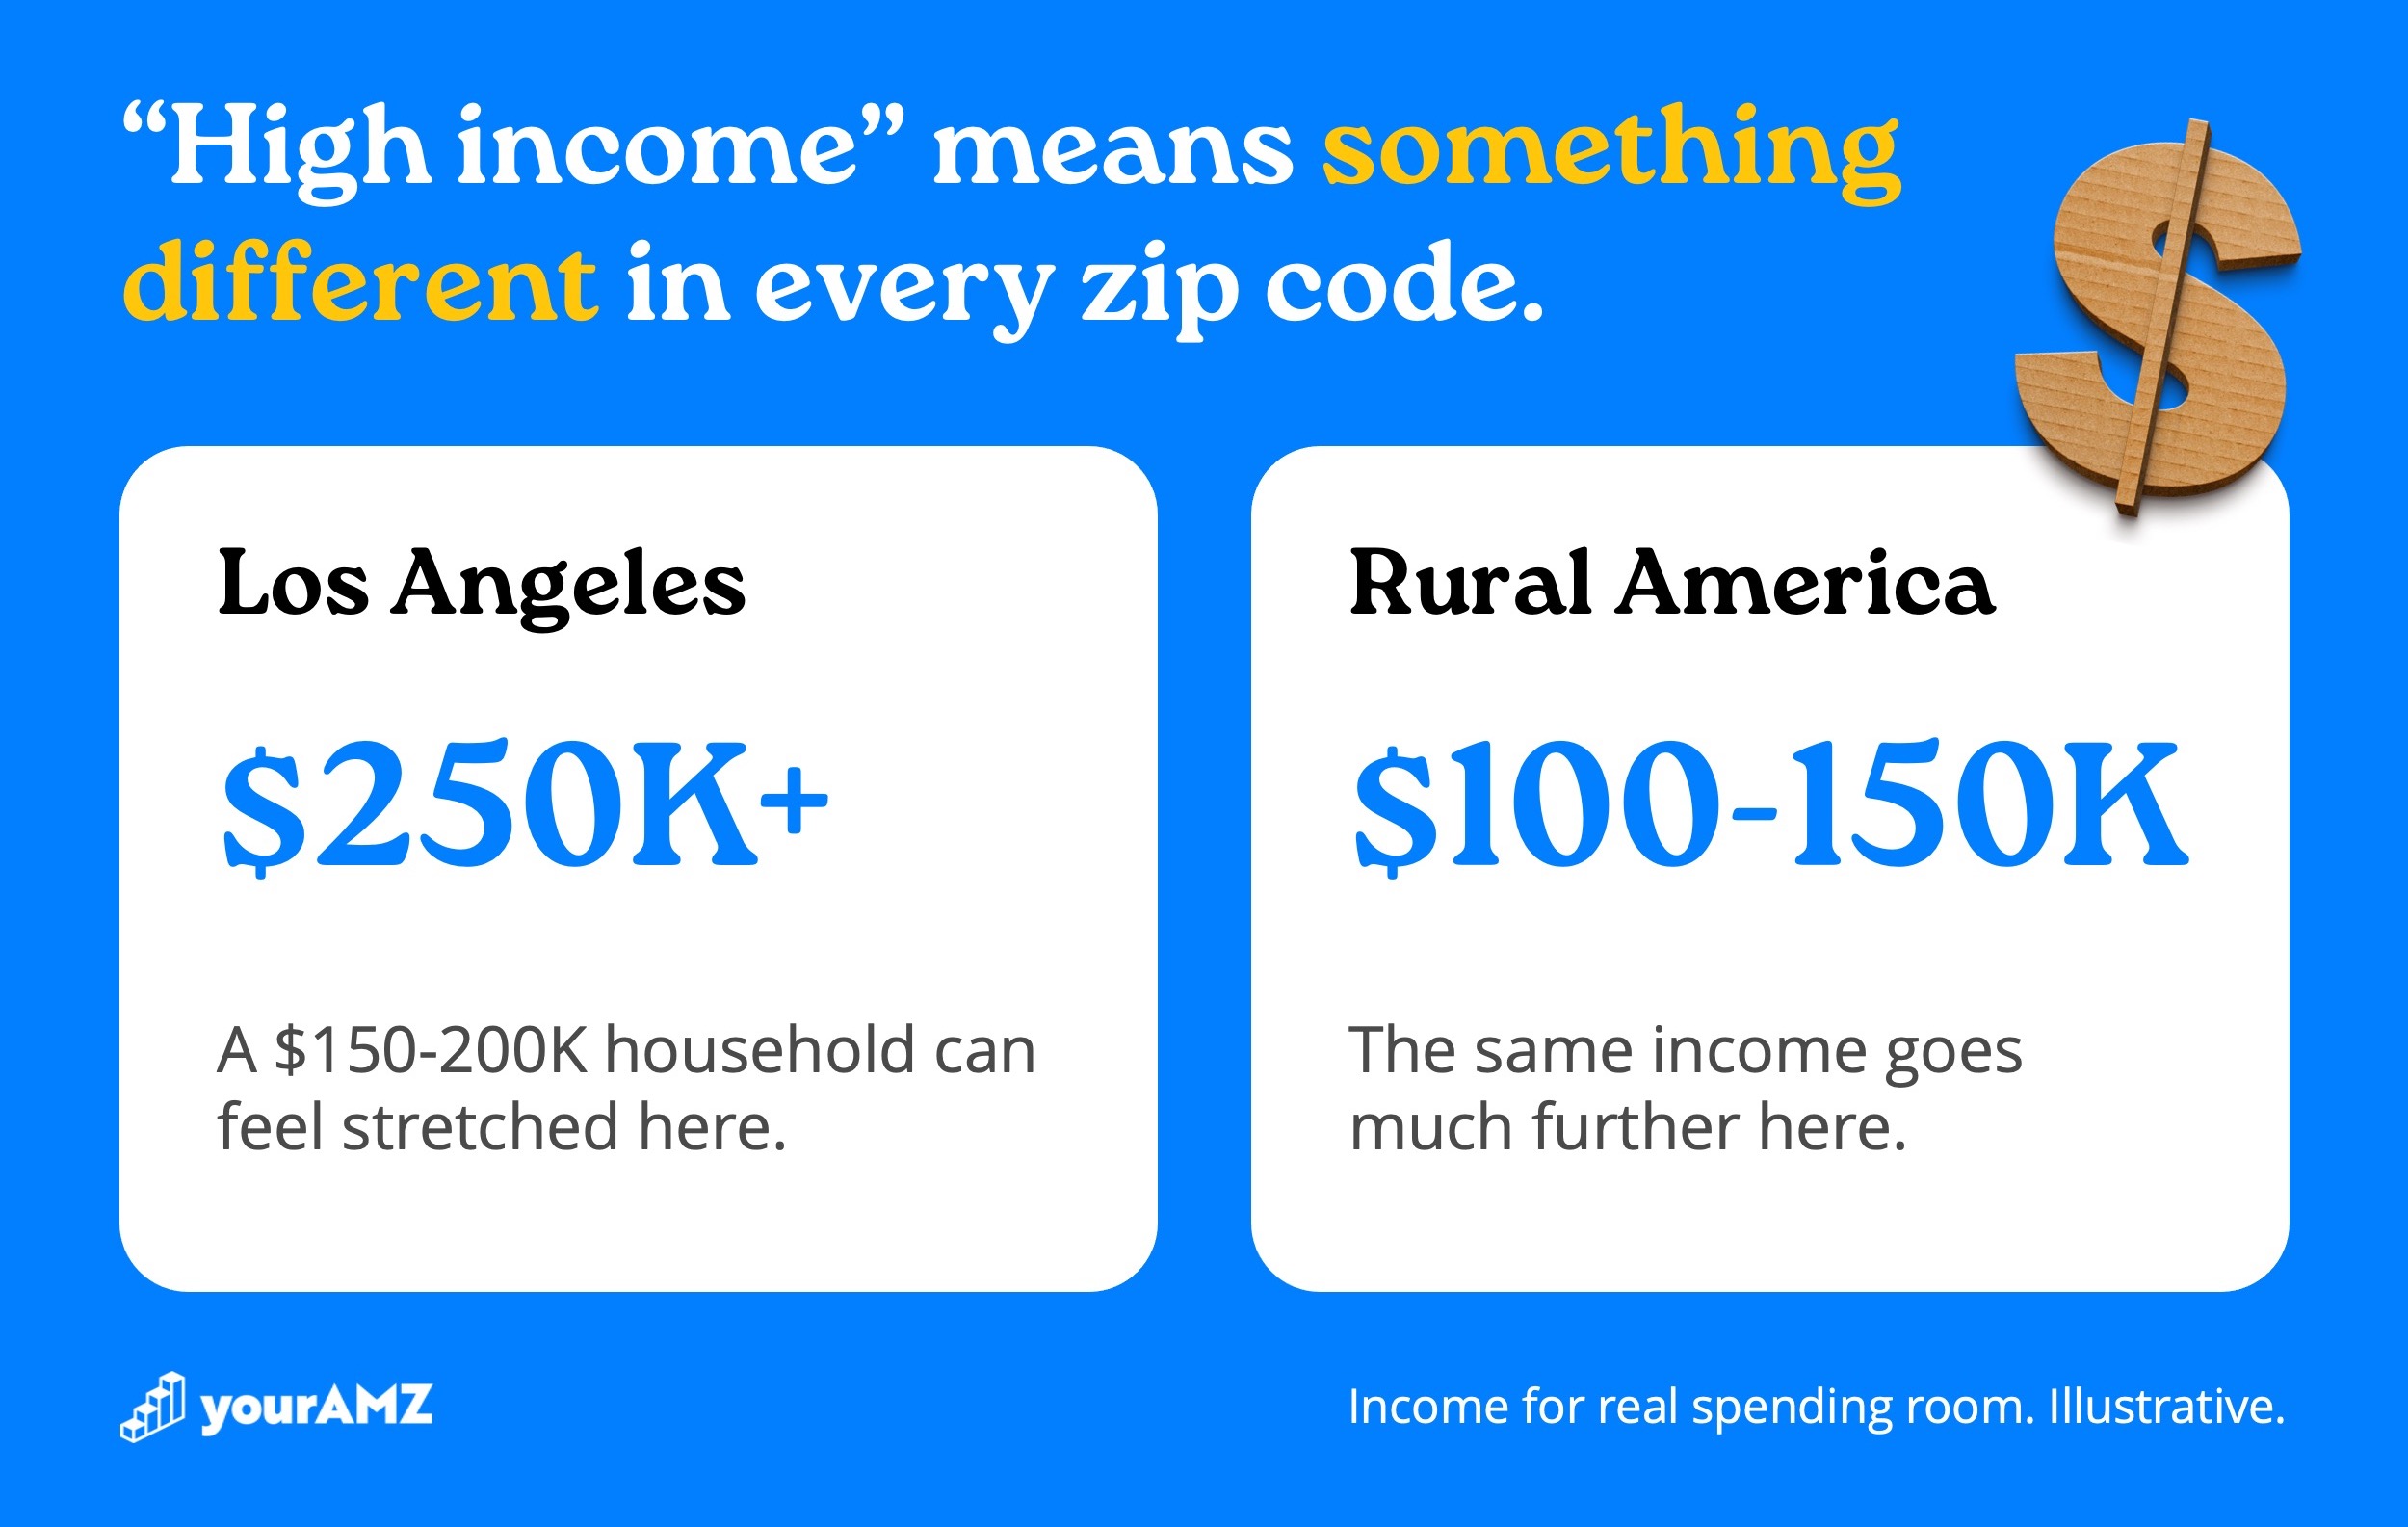
Ken's example is income. A household earning $150-200K per year in Los Angeles may feel stretched. The same income in a rural part of the country goes much further. A brand that believes its buyer is "high income" is often selling to people with high disposable income, and the income it takes to get there changes by location. In LA the line might sit above $250K; in rural America it might be $100-150K. Pair the demographic with location and the real customer gets much easier to find.
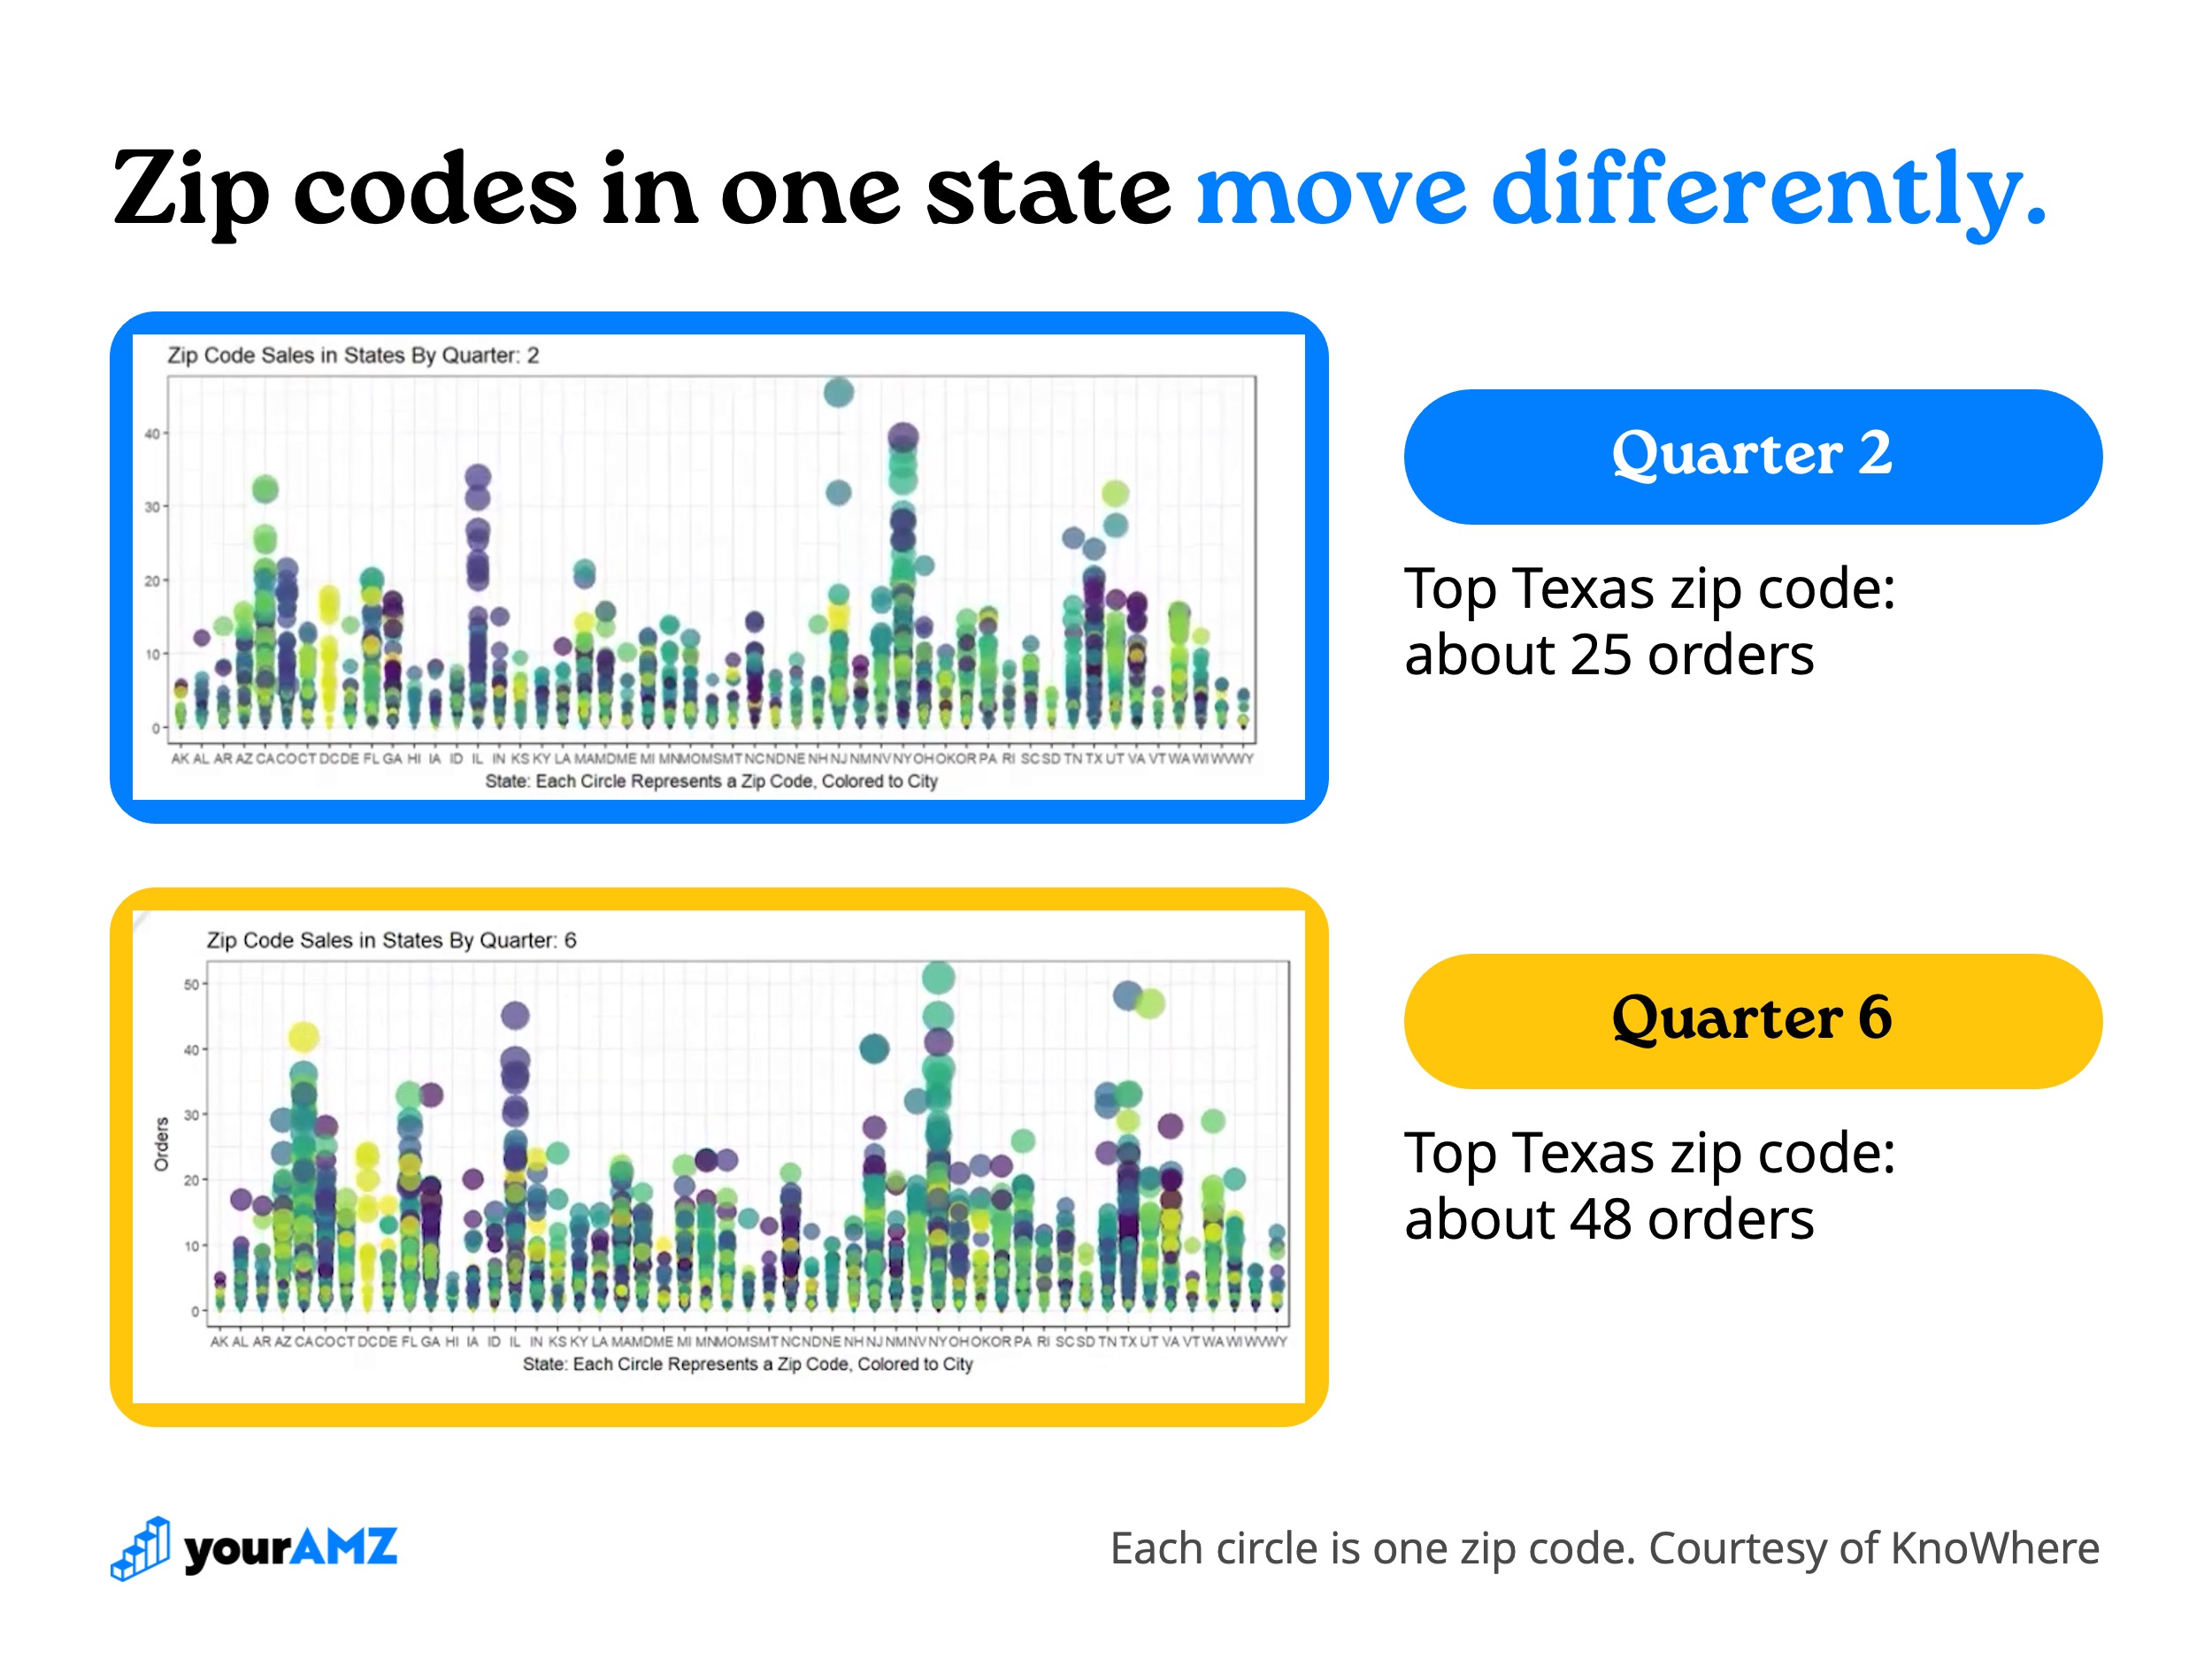
Location also changes over time. Ken's charts below plot each zip code's orders by state for one client, with every circle a zip code colored by city. Between quarter 2 and quarter 6, the top zip codes in some states climbed while others fell, and zip codes inside the same state took different paths. A state or city setting treats them all the same.
Short events do the same thing. During a large East Coast snowstorm, one of Ken's clients saw sales drop across a big share of its potential buyers, then rebound afterward. The weather in those zip codes predicted the dip better than any demographic filter could.
The data nobody else uses
Ken's models go well past standard marketing data. Each layer, such as home value, education, commute time, or the weather, tells part of the story of why a sale happened where it did. He calls this geo-causality: finding what actually drives sales in the places they occur.
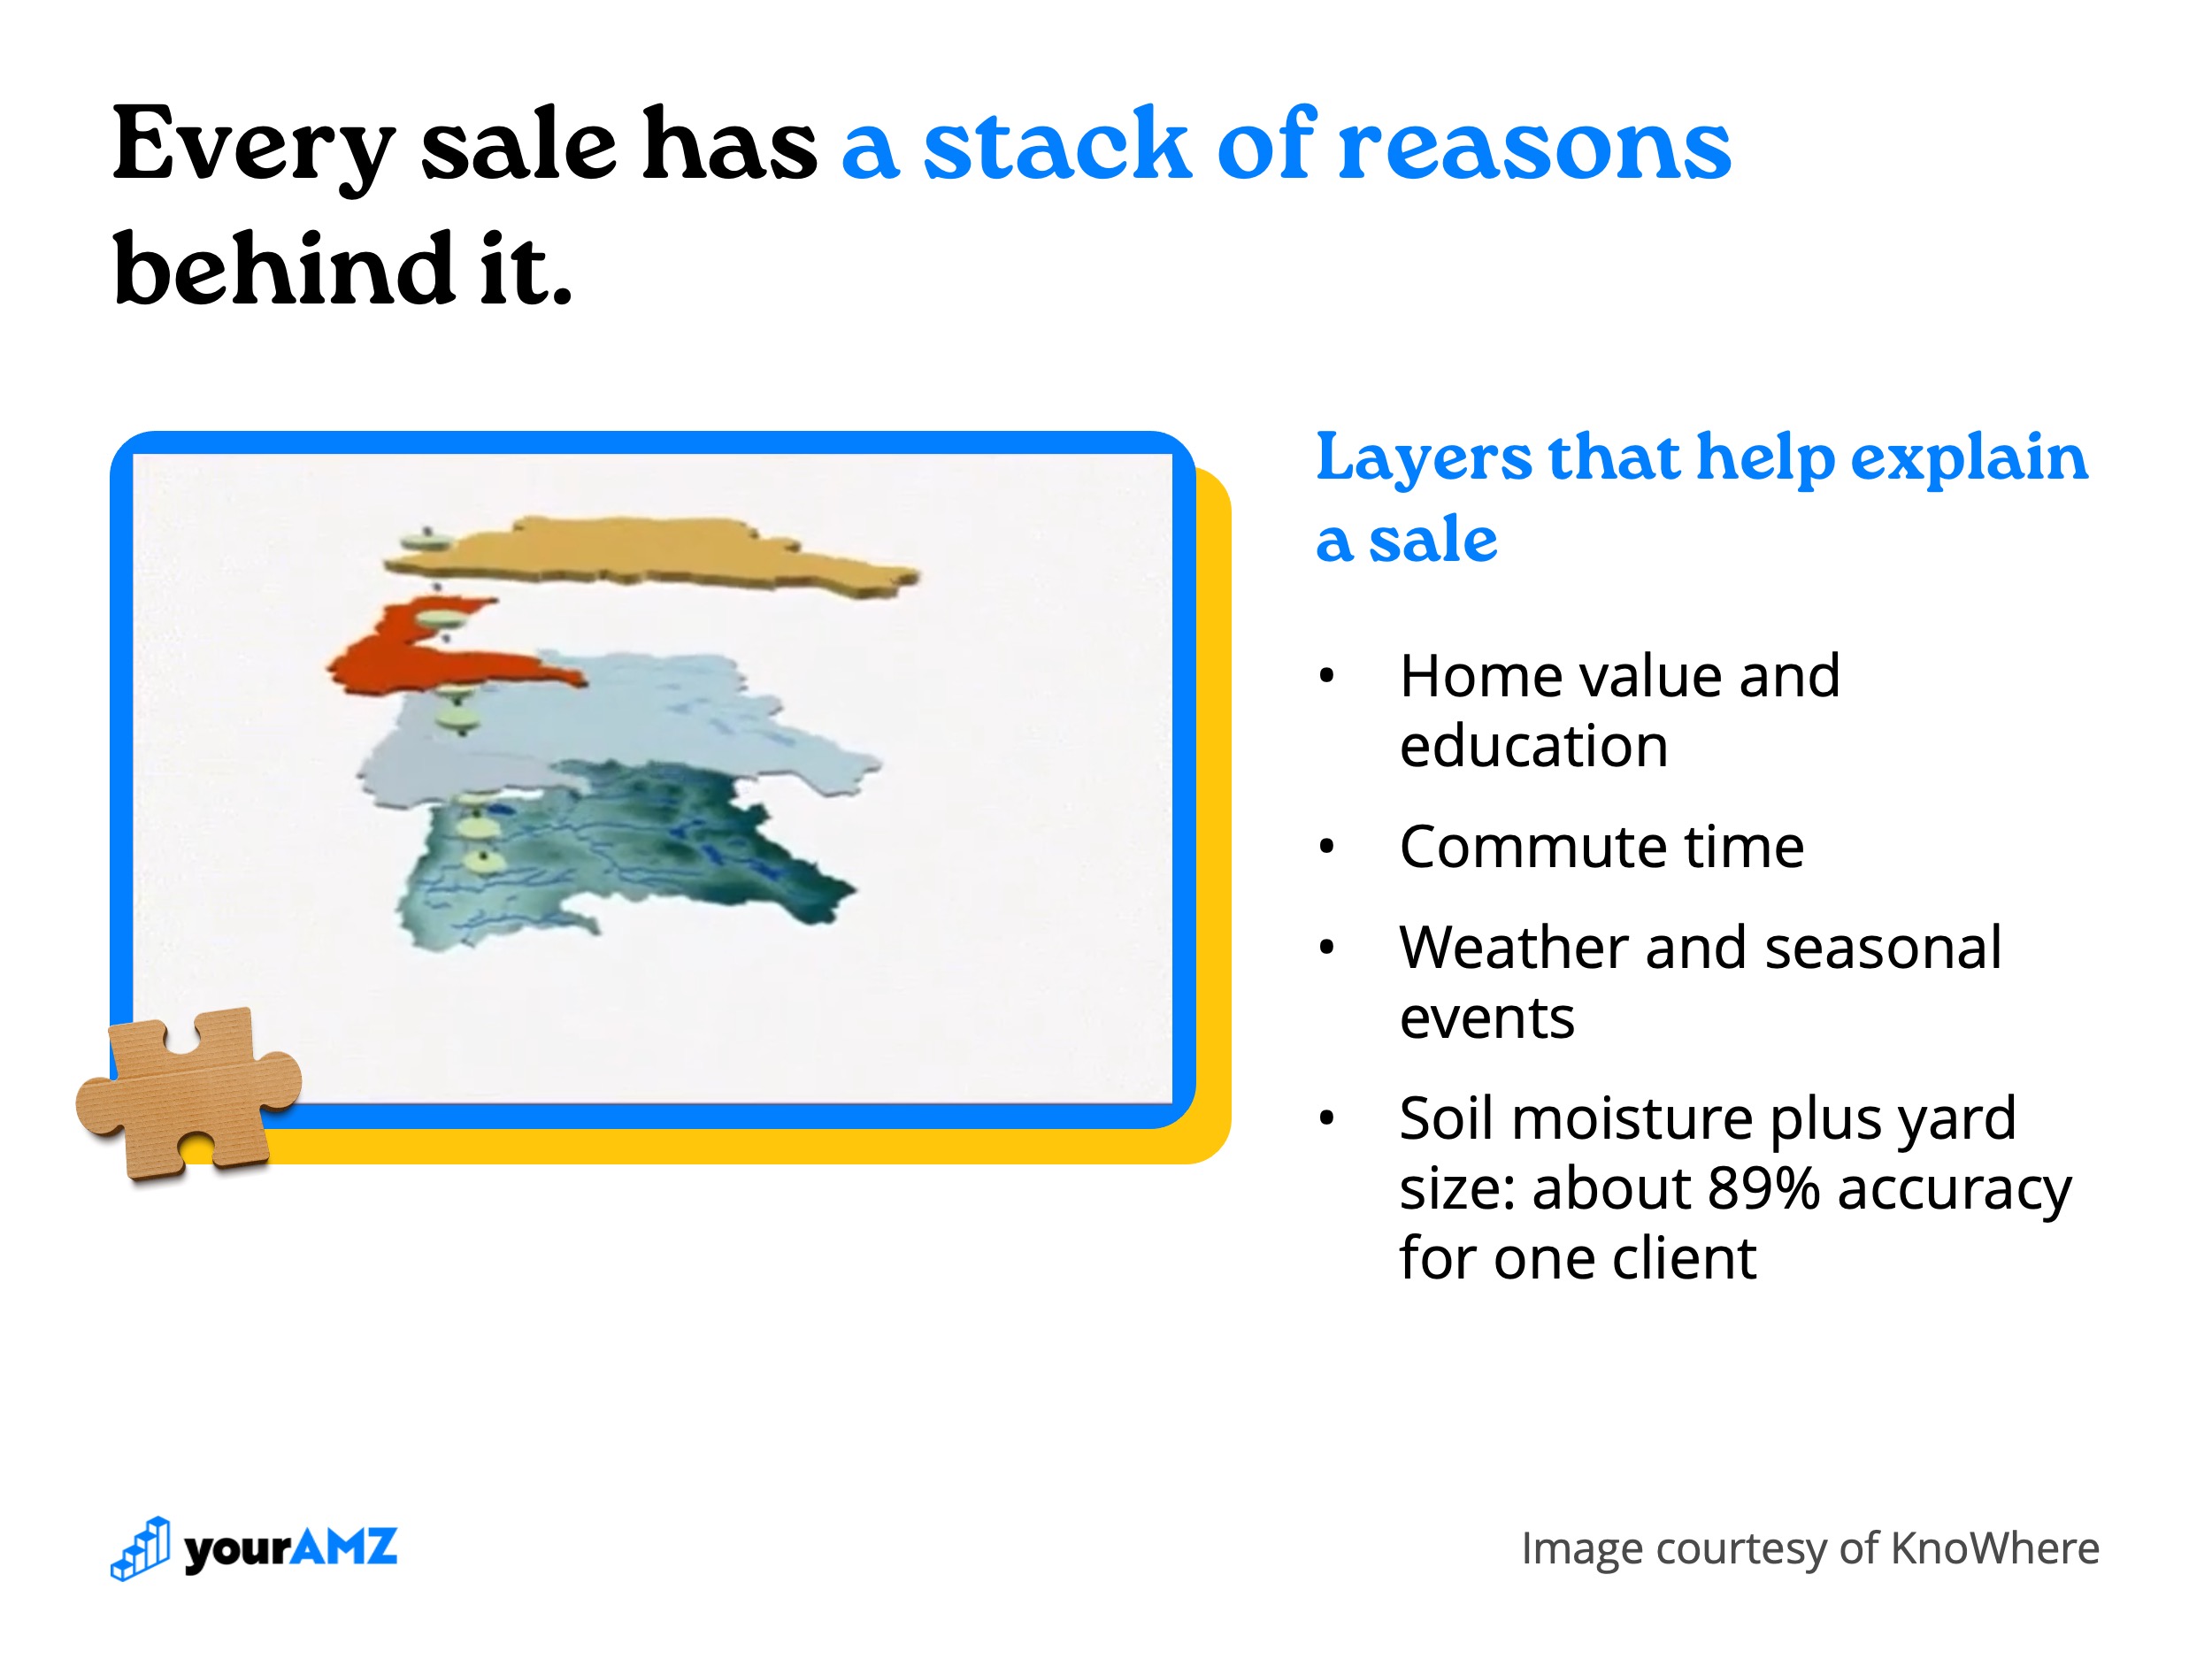
Some of the strongest layers come from outside marketing entirely. For one client (he keeps the industry private), soil moisture and surface geology, combined with yard size and income, predicted where the client's historical customers clustered with about 89% accuracy. The client used those findings to target match markets it had never reached, and it had the best month of leads in its history.
Can't I just paste my zip code data into AI?
You can, and you'll learn which zip codes sell best. That's where the analysis starts. A sales-by-zip list can't show you:
- Which zip codes are over-served, getting more impressions than their potential justifies
- Which zip codes are under-served, with potential your ads never reached
- Which zip codes are performing about as expected
- Where your match markets are, including zip codes with zero sales so far
Your sales data only describes where you've been shown. One zip code might have produced $1M in sales, and another across the country could produce the same, but your data has no way to say so. Finding it takes knowing which data to add, which statistics to run, and how to read the result for one brand.
How we apply it on Amazon: from auto to zip code
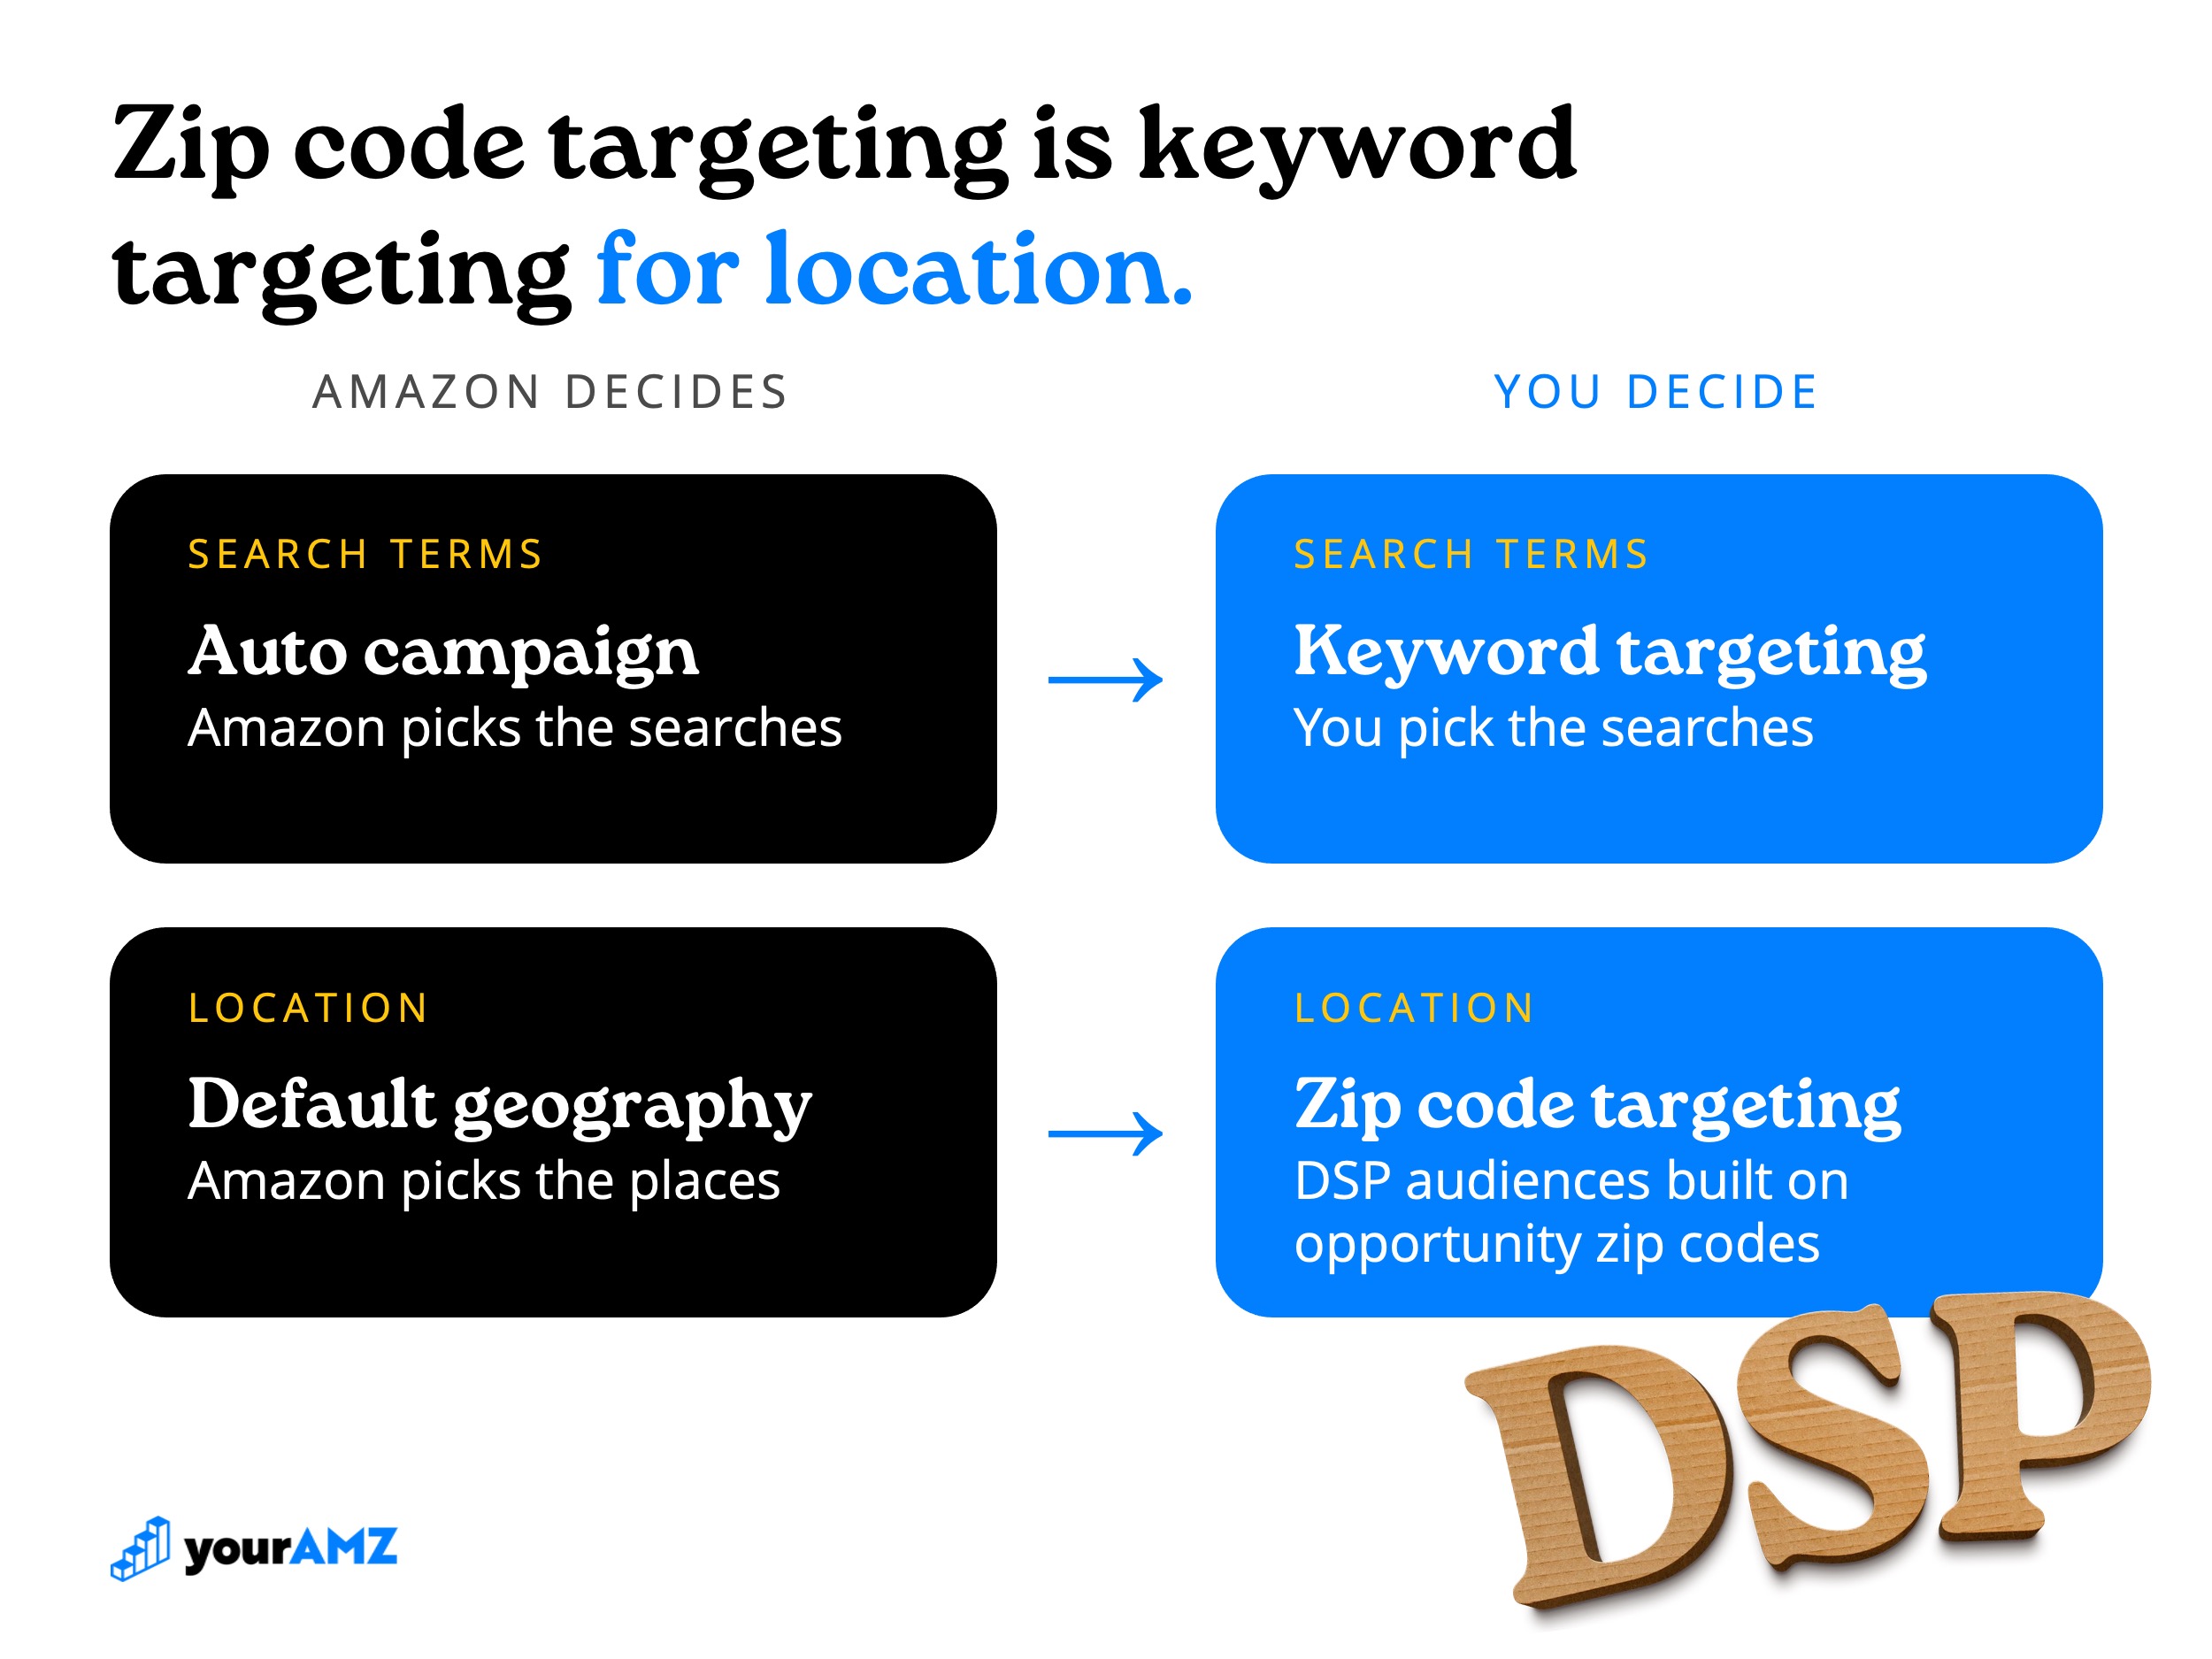
On Sponsored Products, location isn't a setting. Anyone who searches your keyword can see your ad wherever they live, so the geography you get is whatever the auction hands you. That's the same position an auto campaign puts you in with keywords: Amazon decides.
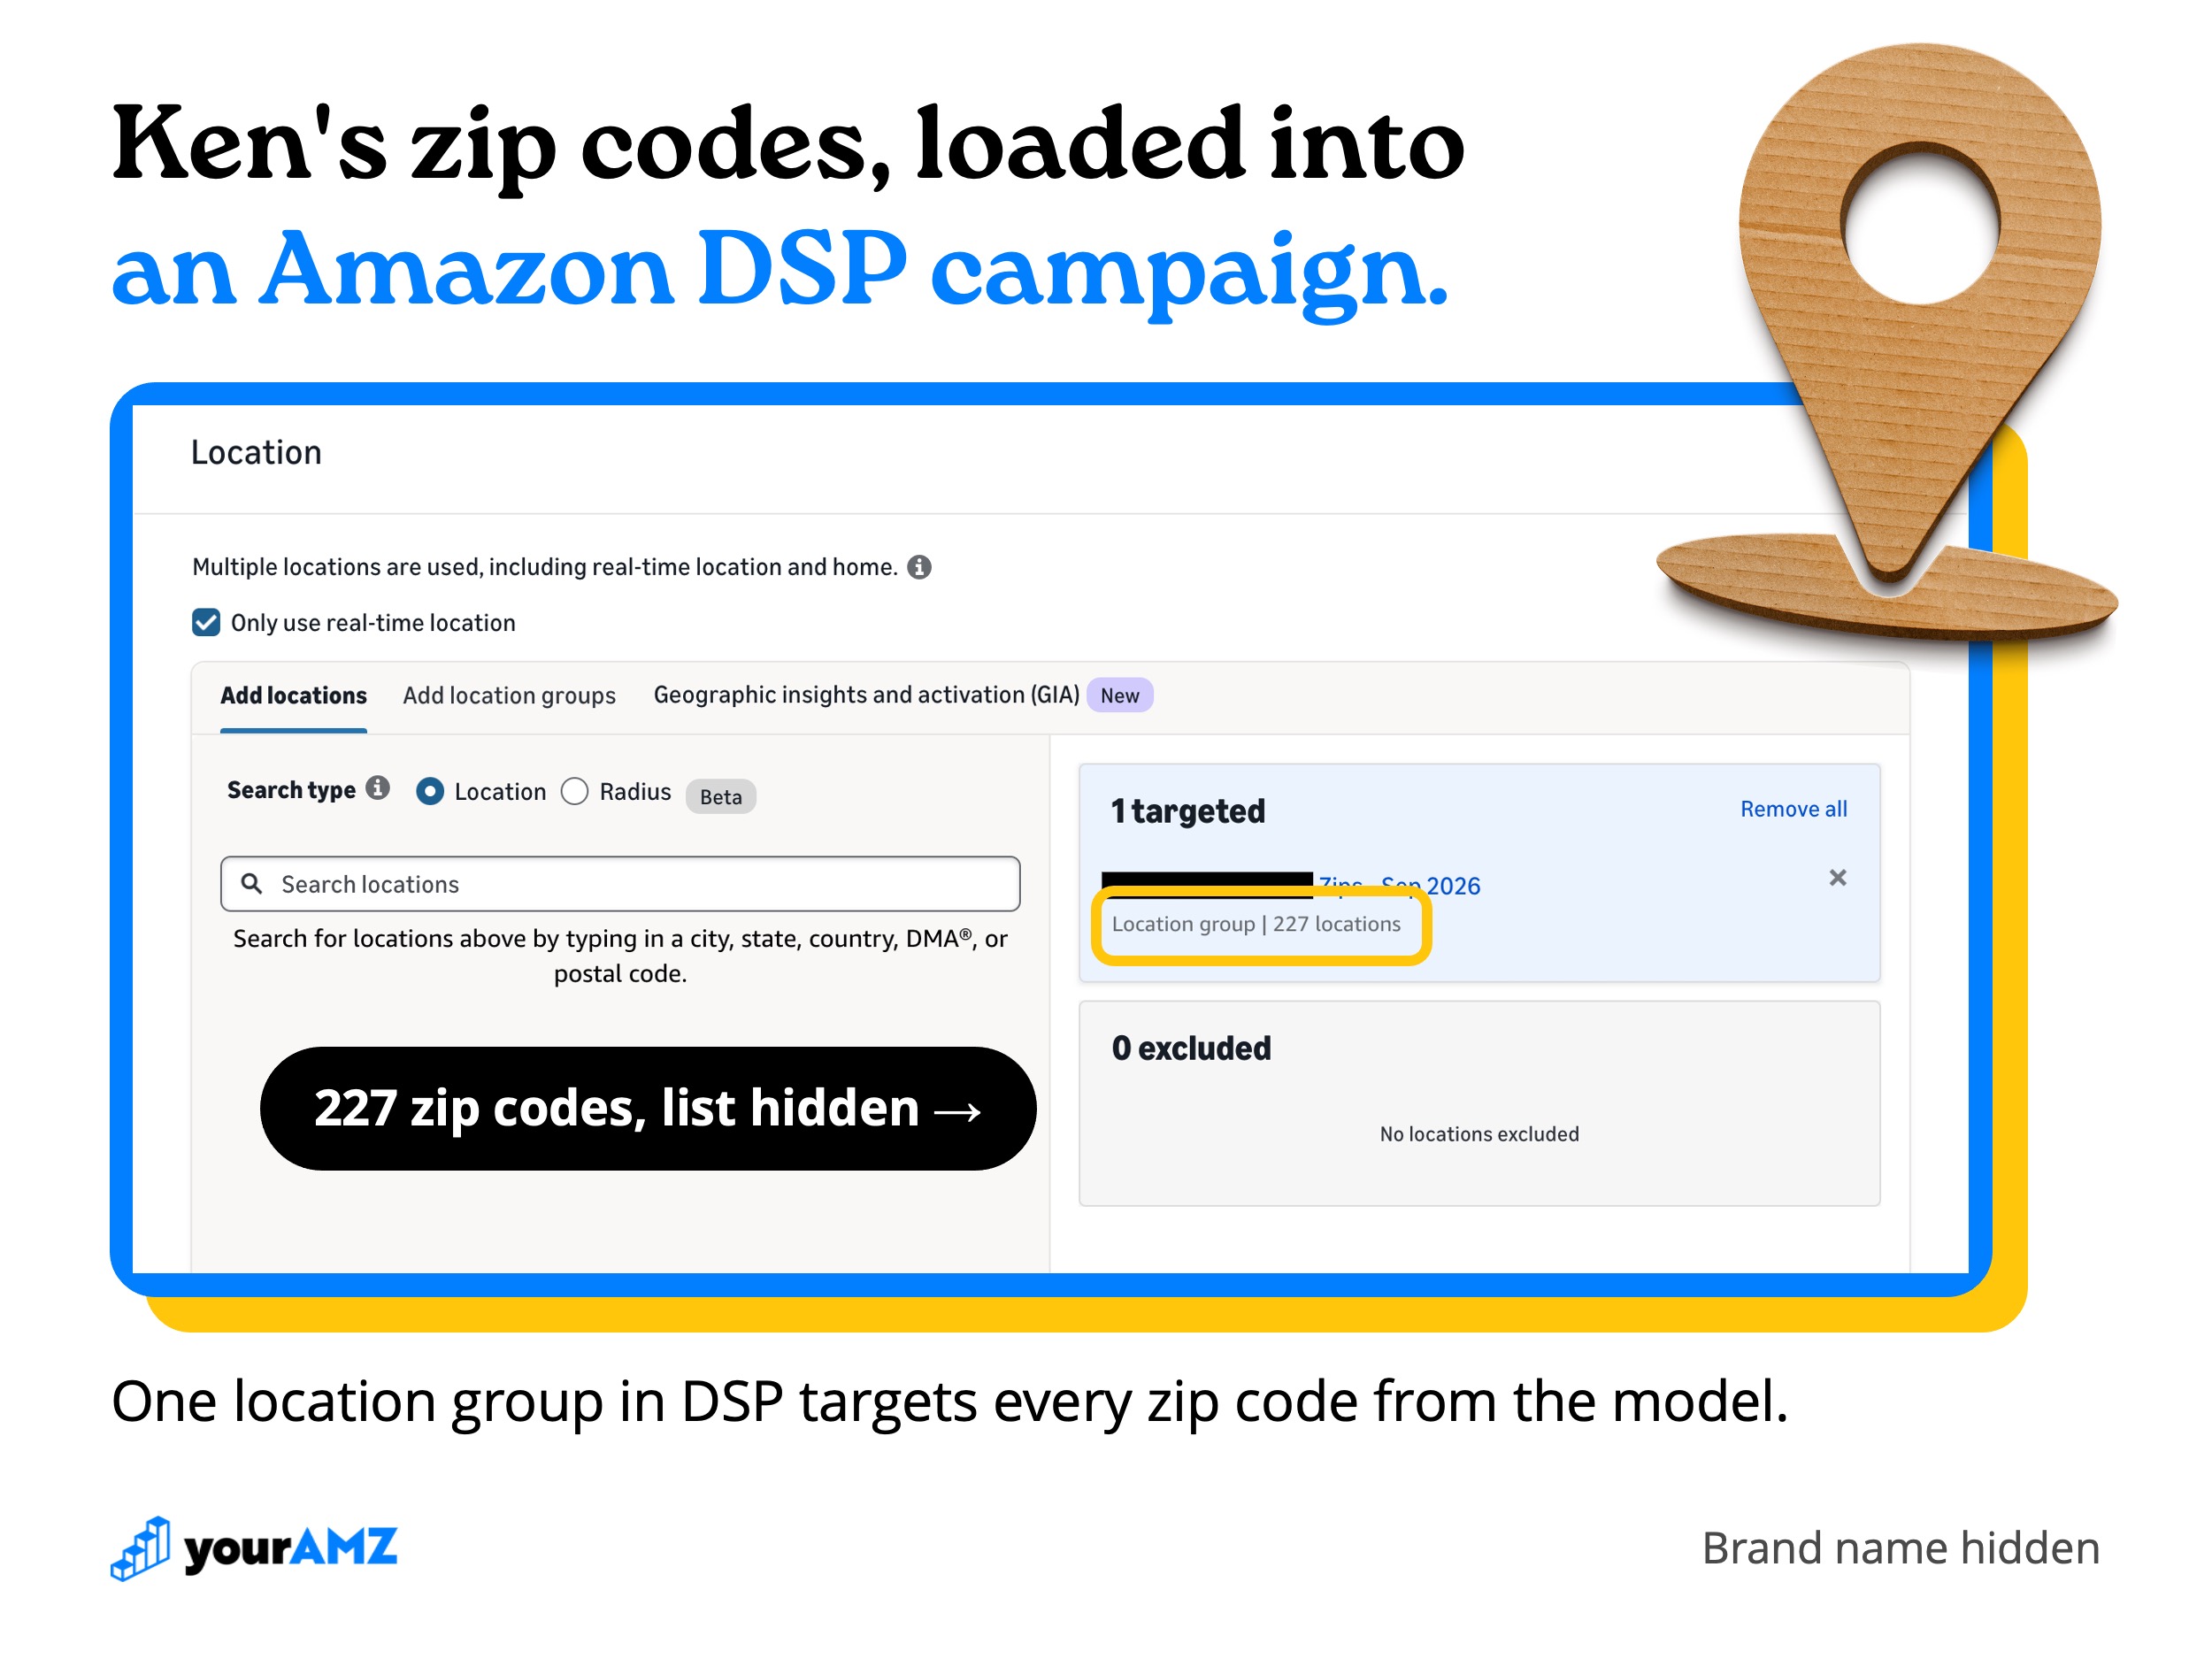
Amazon DSP is where location becomes something you can steer. When we build top-of-funnel DSP audiences, we layer Ken's opportunity tiers in alongside demographics, so prospecting spend goes to the zip codes most likely to buy. Going from Amazon's default geography to zip code targeting is as big a step as going from an auto campaign to keyword-level targeting.
We've run this for a premium skincare brand we work on with Ken. Company-wide, Ken's geo work turned the brand's trajectory around: by his measurement, new-customer growth was up about 300% within six months across the channels it sells through, without increasing ad spend.
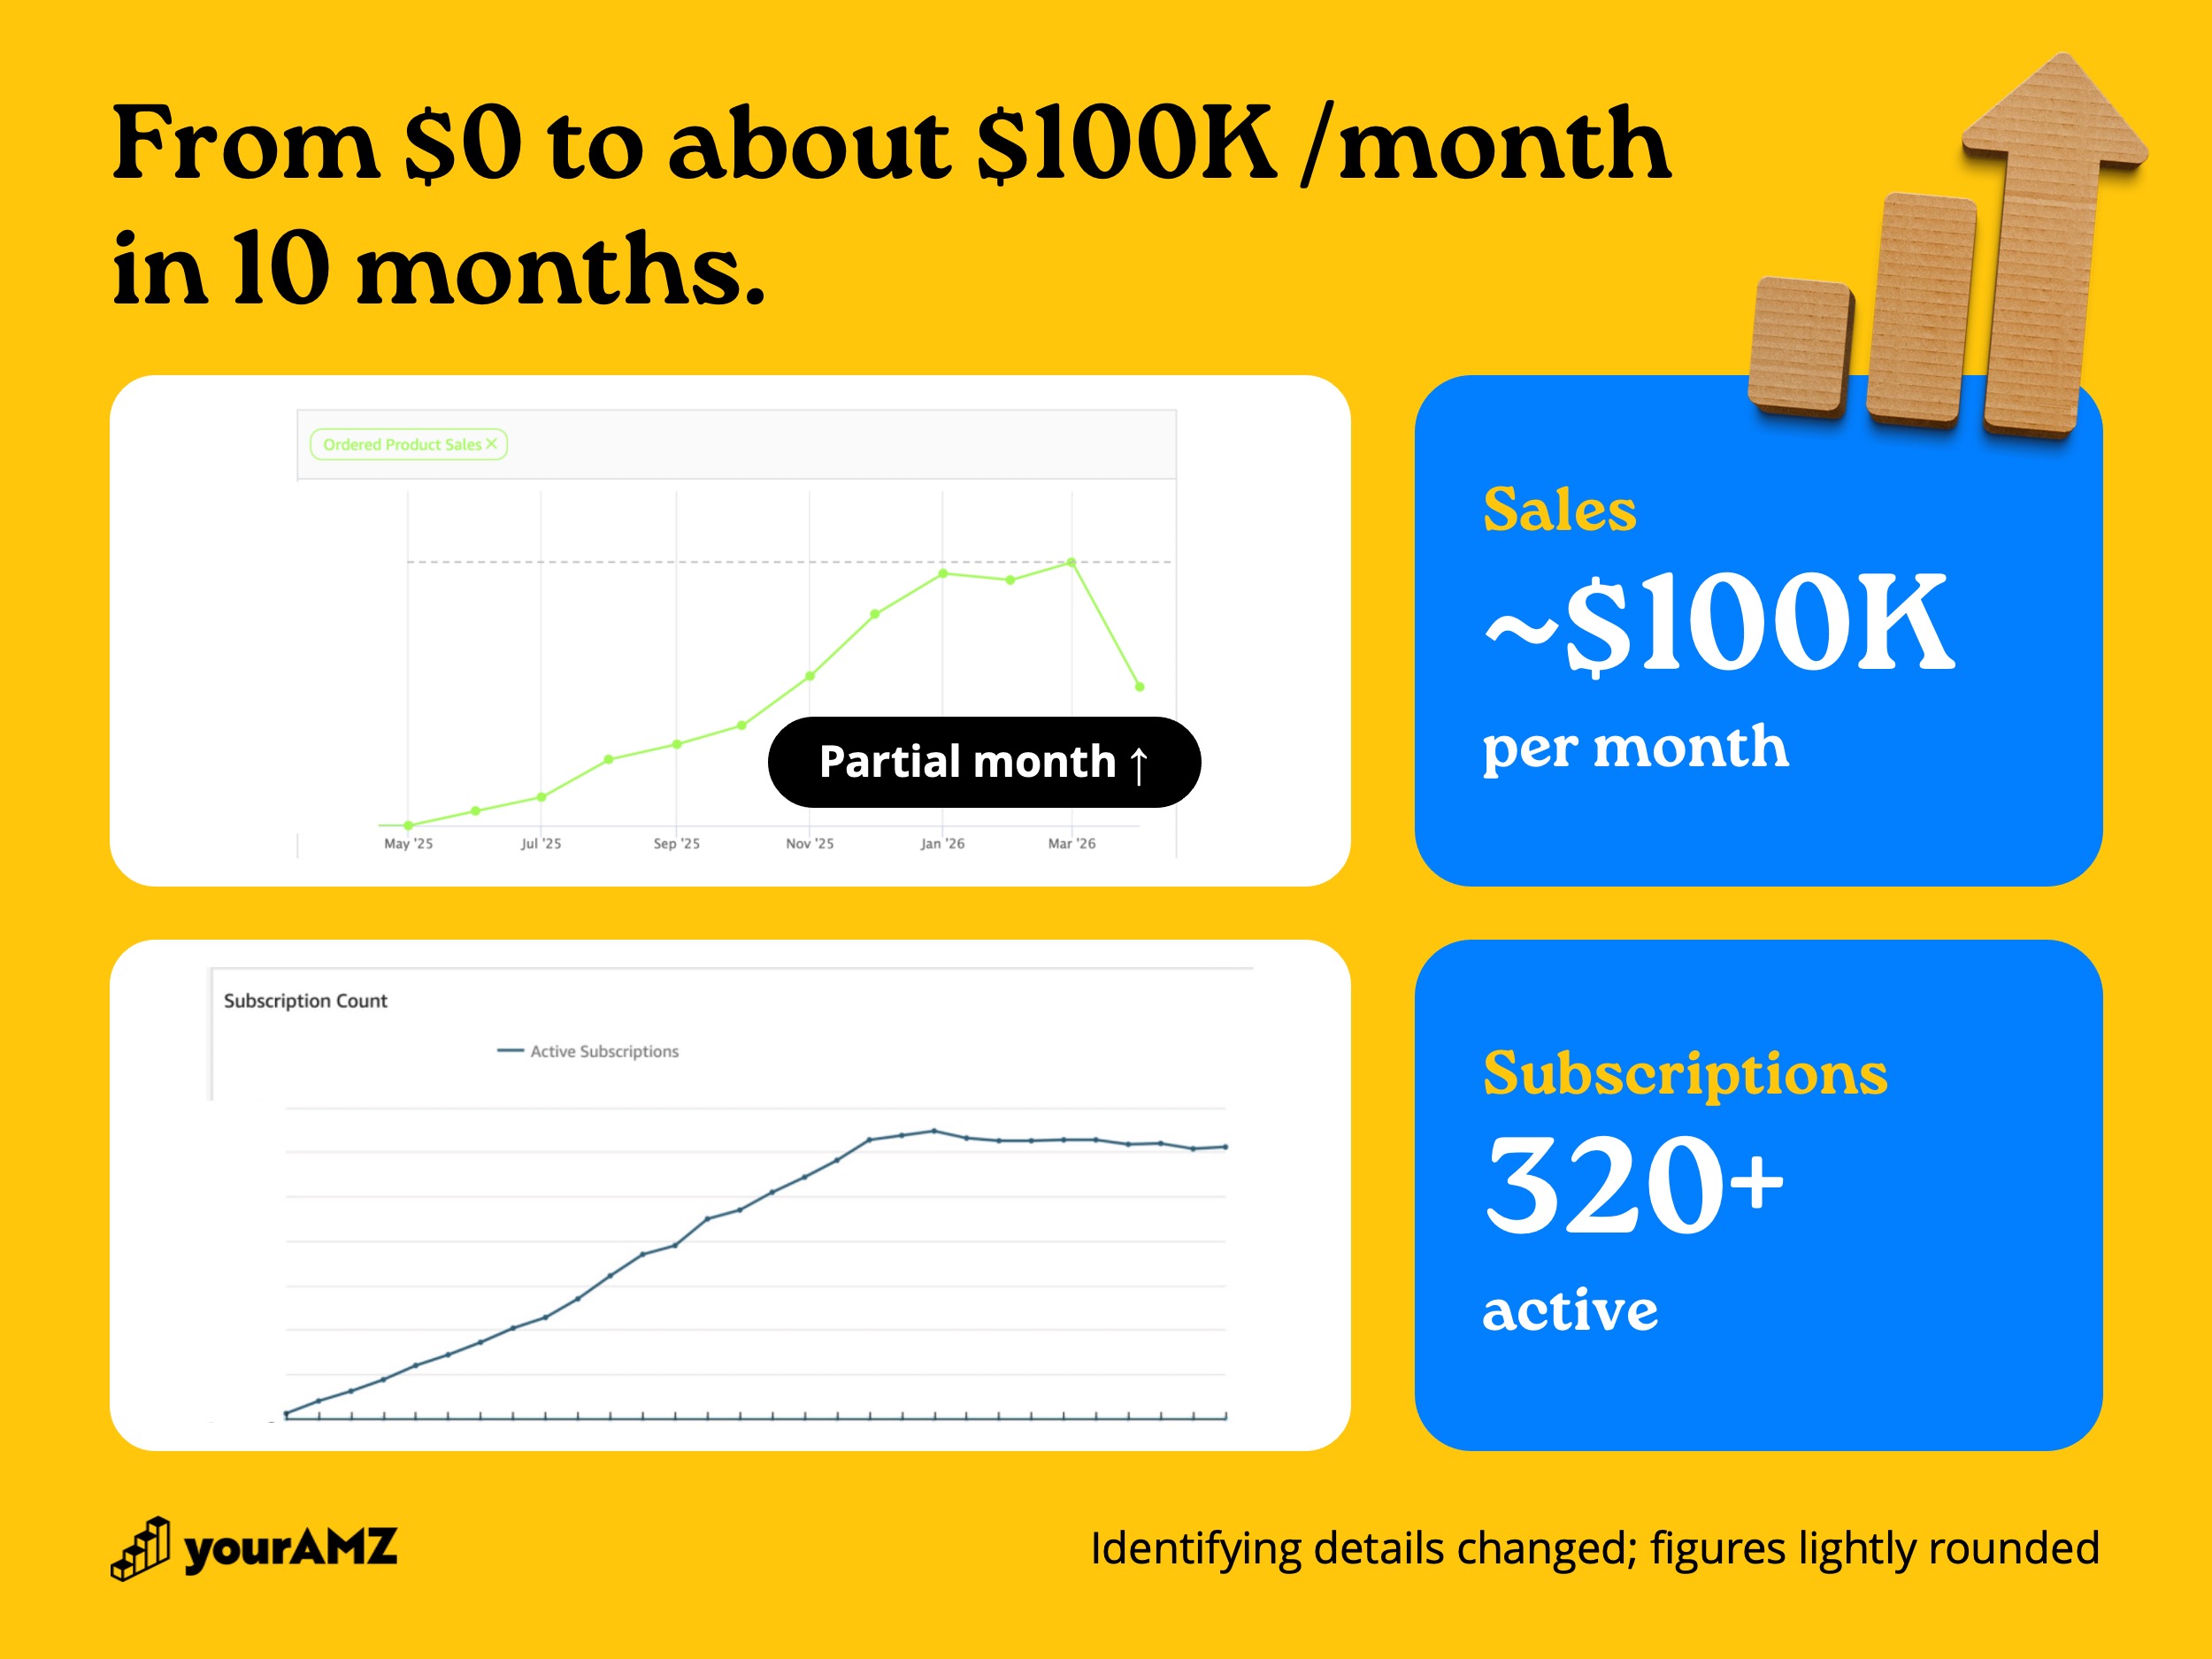
Amazon is a separate result. The brand launched there from $0 in May 2025 with us running the account, and Ken's opportunity tiers shaped the DSP audiences at the top of the funnel. Ten months later, Amazon sales were running at about $100K per month, and the brand had built more than 320 active Subscribe & Save subscriptions. The charts below show the climb, from the first month of sales.
What does working with a geospatial analyst look like?
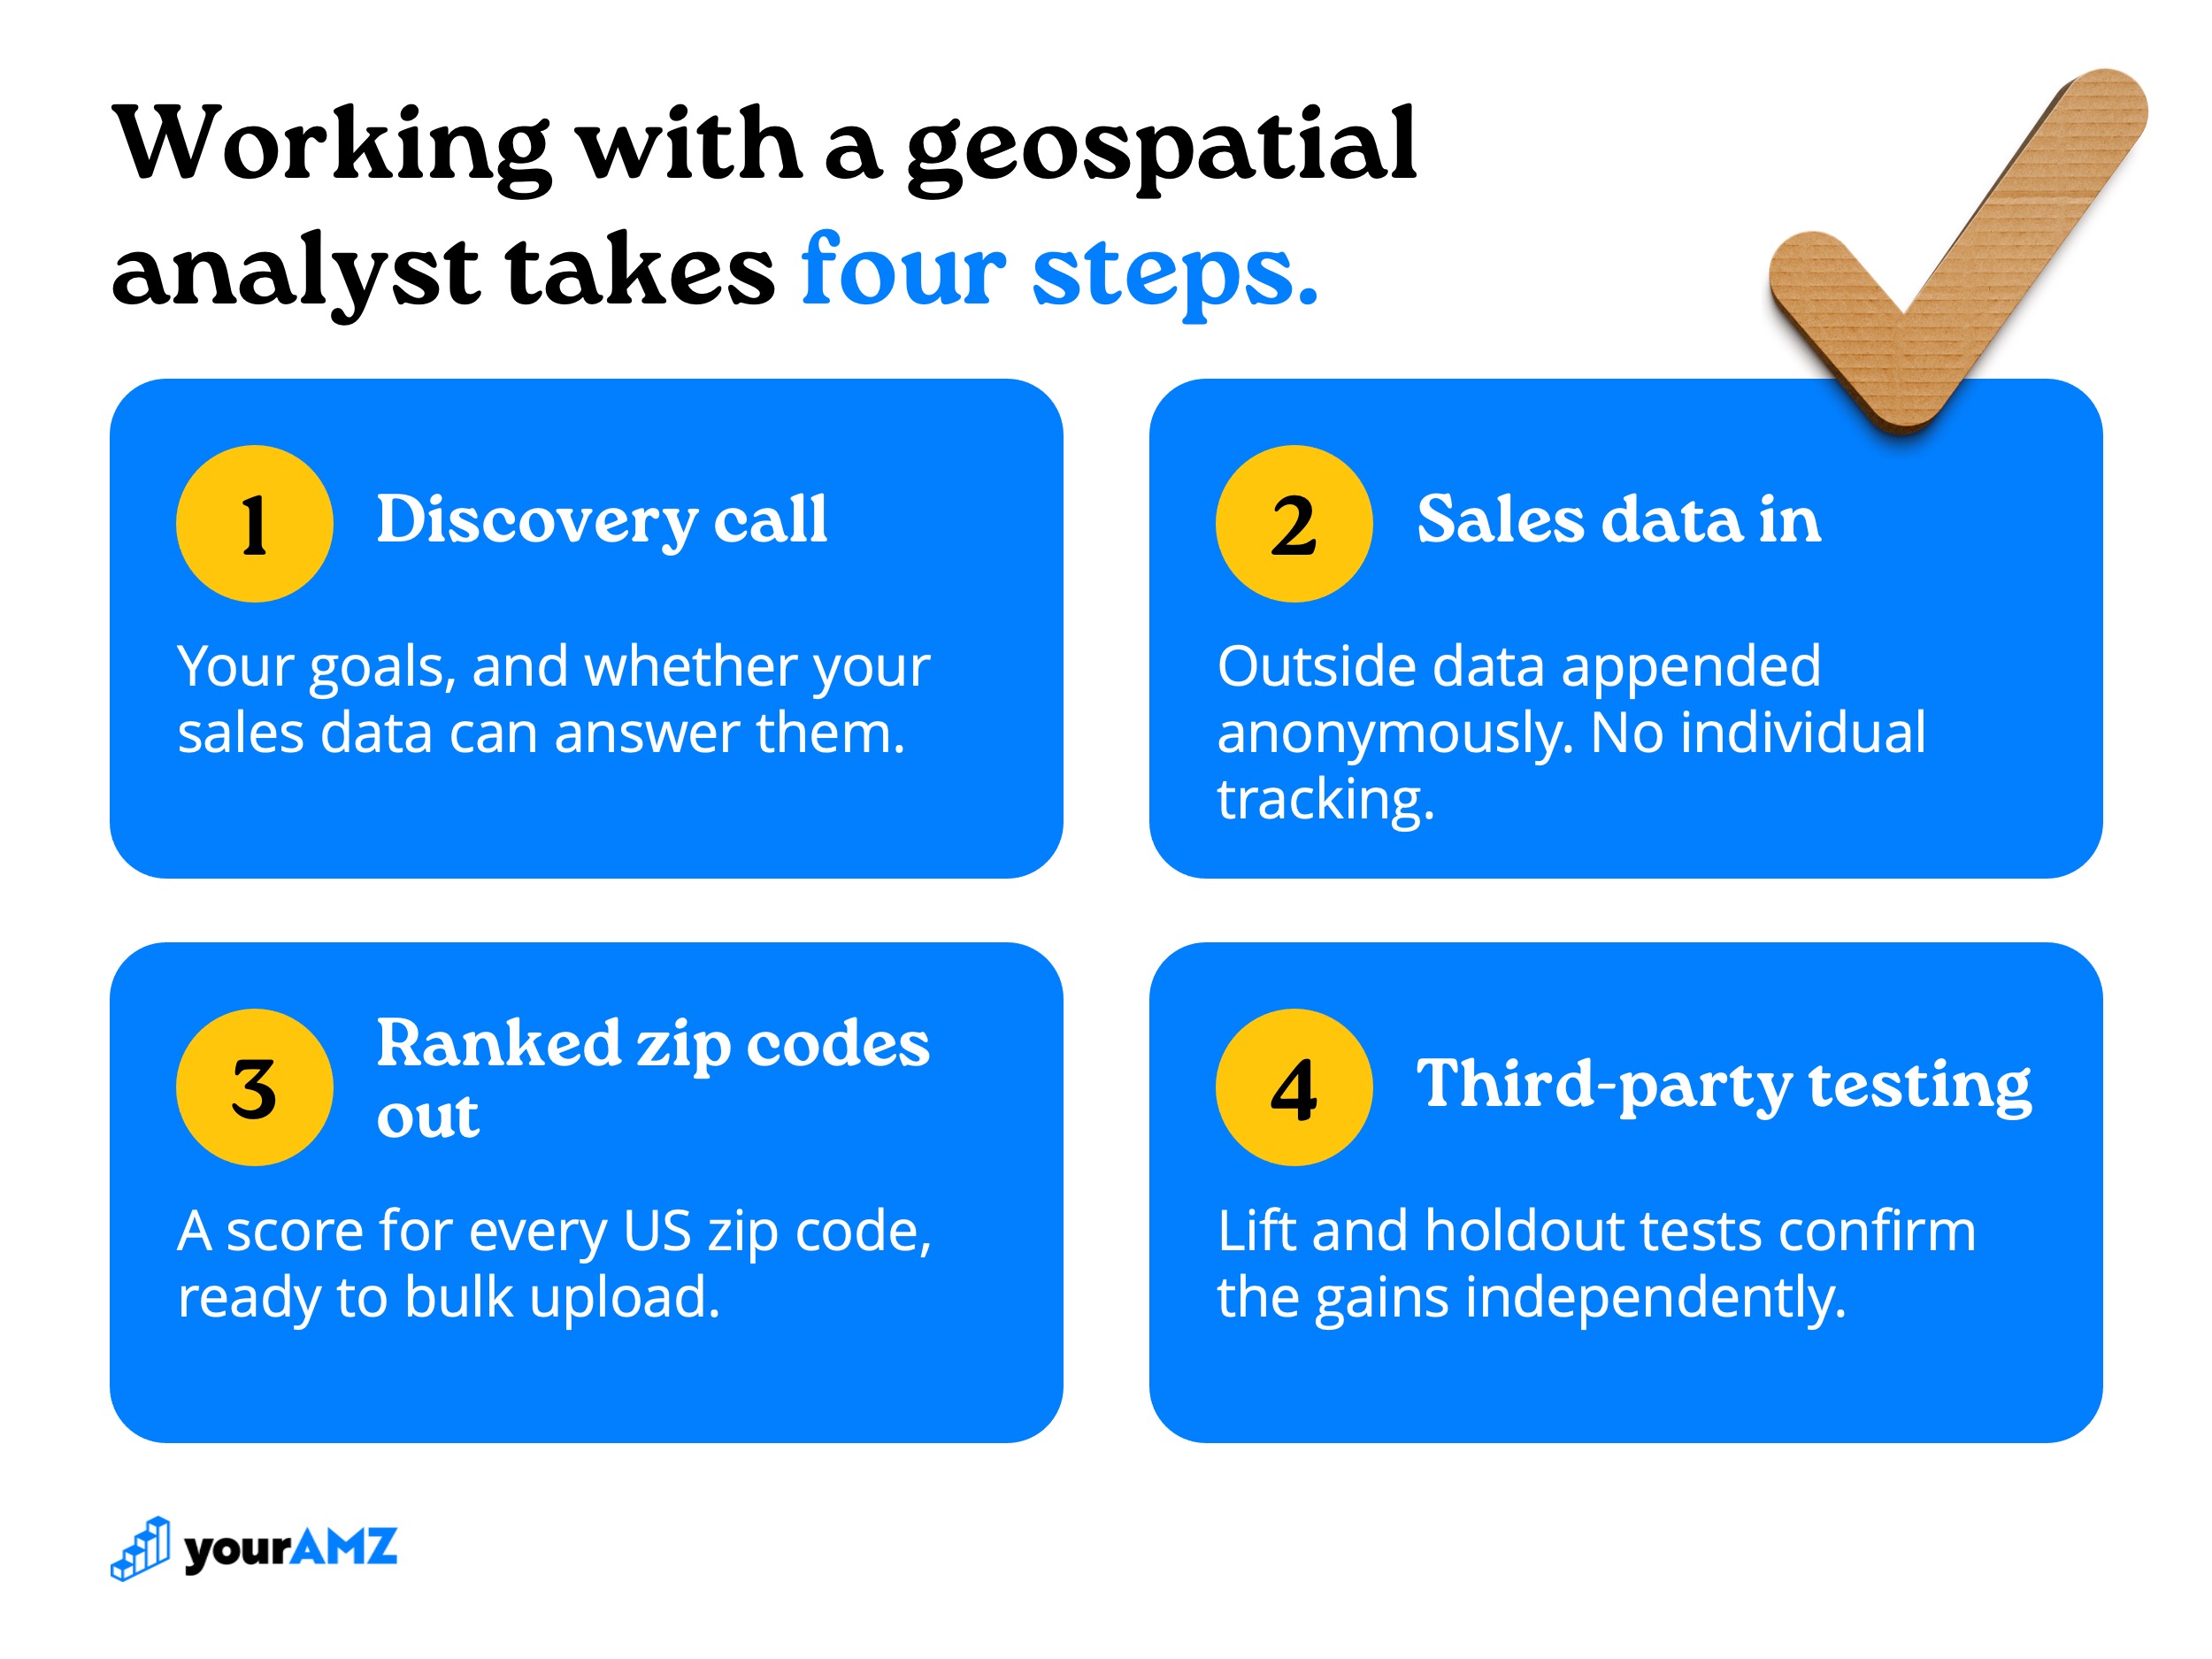
Simpler than the analysis behind it. Ken works in four steps:
- Discovery call. A conversation about your goals and whether your data can answer them. If you have sales data and run ads, you have what he needs.
- Your sales data in. KnoWhere appends outside data to your sales data anonymously. No individual tracking data is involved, so the model holds up as privacy rules tighten.
- Ranked zip codes out. Every US zip code gets a propensity score for your product, delivered as a spreadsheet your team or agency can bulk upload. Where a platform makes zip-level targeting impractical, the scores roll up to counties or other groupings.
- Testing. Results are checked with third-party lift and holdout testing, so the gains you report to a board have independent numbers behind them.
The model earns its keep beyond ads, too. Ken's clients use it to explain decisions to investors and boards, and even to choose where a billboard goes.
To find out whether your sales data hides match markets, talk to Ken directly at weknowhere.com.
Where else is your ad efficiency going?
Location is one place efficiency hides as an account grows. The others usually sit inside the ad account itself: branded spend making ROAS look better than the business is doing, budgets running mostly through auto campaigns, and proven search terms getting a fraction of the spend they've earned.
If your brand sells $100K+ per month on Amazon, we'll audit your advertising for free and walk you through it on a call: where your budget is working, where it's leaking, and what we'd change first. Every number comes from your own reports, so you can check it line by line.
Unlock Your Amazon Potential
%20(1).avif)
Continue Reading
We Ignore ROAS as an Account-Level Metric, and So Should You